Zoom Feature
To begin, please sign in to the Analytics Dashboard using your nanoStream Cloud/Bintu account credentials.
If you have not created an account yet, you can sign up or reach out to our dedicated sales team via the contact form or by sending an email to sales(at)nanocosmos.de.
This feature is available for multiple widgets. The zoom tag shows if this feature is supported for this chart.
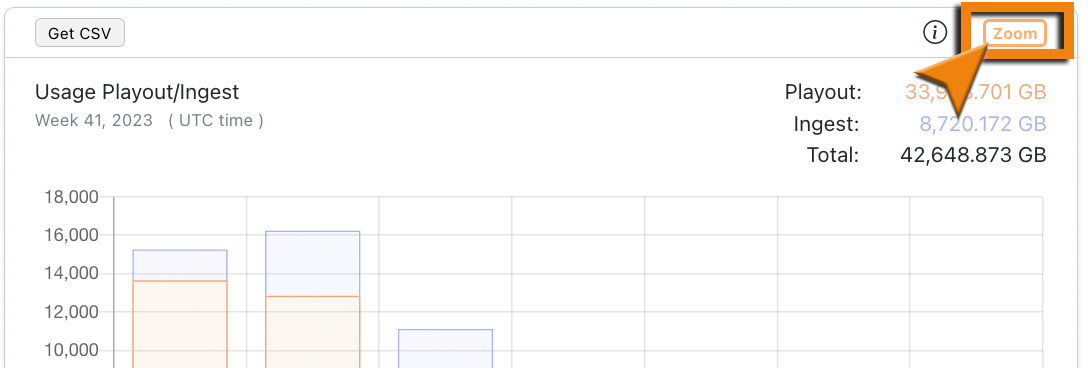 Screenshot: Zoom Tag
Zoom in for more insight
By clicking on a bar in one of the supported widgets an overlay window is being opened. There you can gain more insight about that specific diagram by doing your own research. The table shows the TOP 10 (highest) ranked results depending on the metric and your selected search parameters.
Metrics like max concurrent viewer, latency or other aggregated metrics do rank by their individual parameter of significance. (e.g. viewer count, latency in seconds, etc.)
General
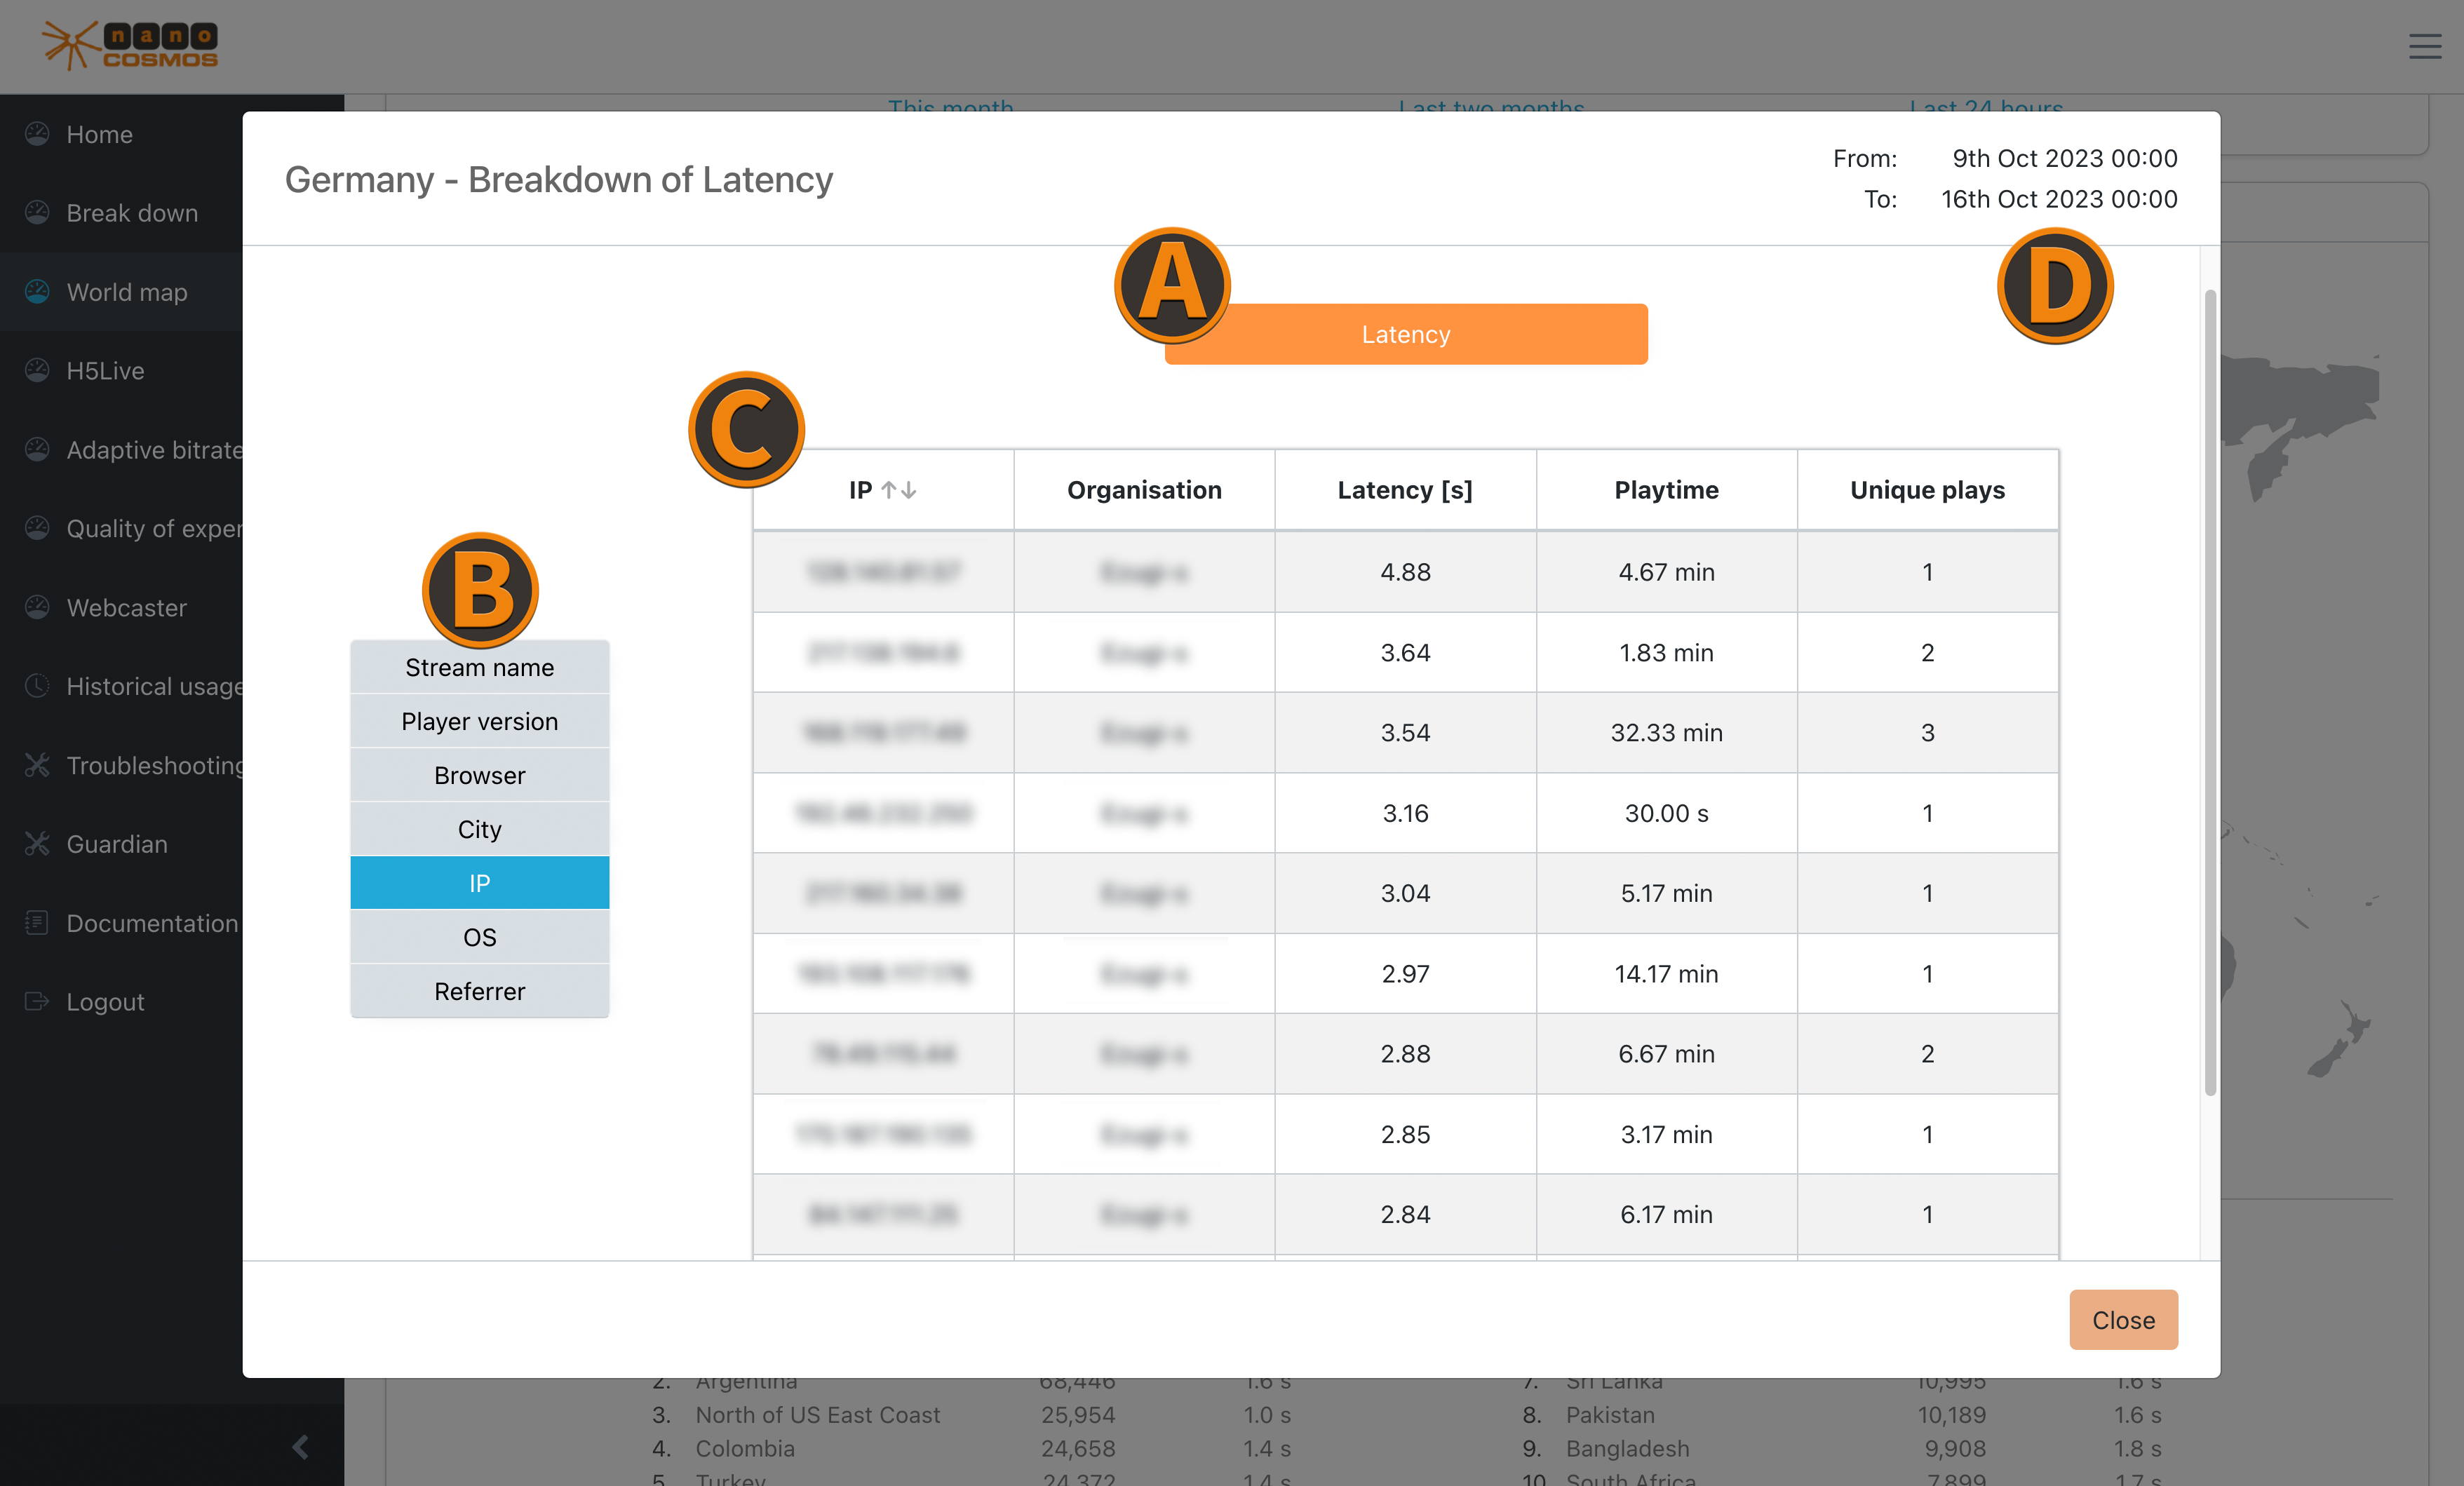 Screenshot: World Map Breakdown
(A) Chosen Metric Category horizontal bar (orange) data category:
A list of the available data categories, like Playout/Ingest, a specific transfer protocol you are interested in (e.g. H5Live) or individual metrics.
The available category options depend on the selected zoom-widgets.
Here is another example for ABR switches from the worldmap tab:

(B) Filtering by Data Features vertical bar (blue) data feature:
This is a data feature you are interested in (e.g. streamname, referrer, country, etc.). These can be used to switch between the metric data to evaluate the results under different points of view.
Most of the zoom menus have these main filters:
- IP
- Stream name
- City
- Country
- Referrer
While Buffering Ratio, Latency, Playtime Average, ABR Viewers, ABR Playtime and ABR Switches and other individual metrics also contain filters for:
- OS
- Player version
- Browser
(C) Table Columns represent the chosen filter and show the corresponding data. You can sort all entries by clicking on a header column.
(D) Selected Time Range displays the start and end of the selected time range.
Zoom on Home
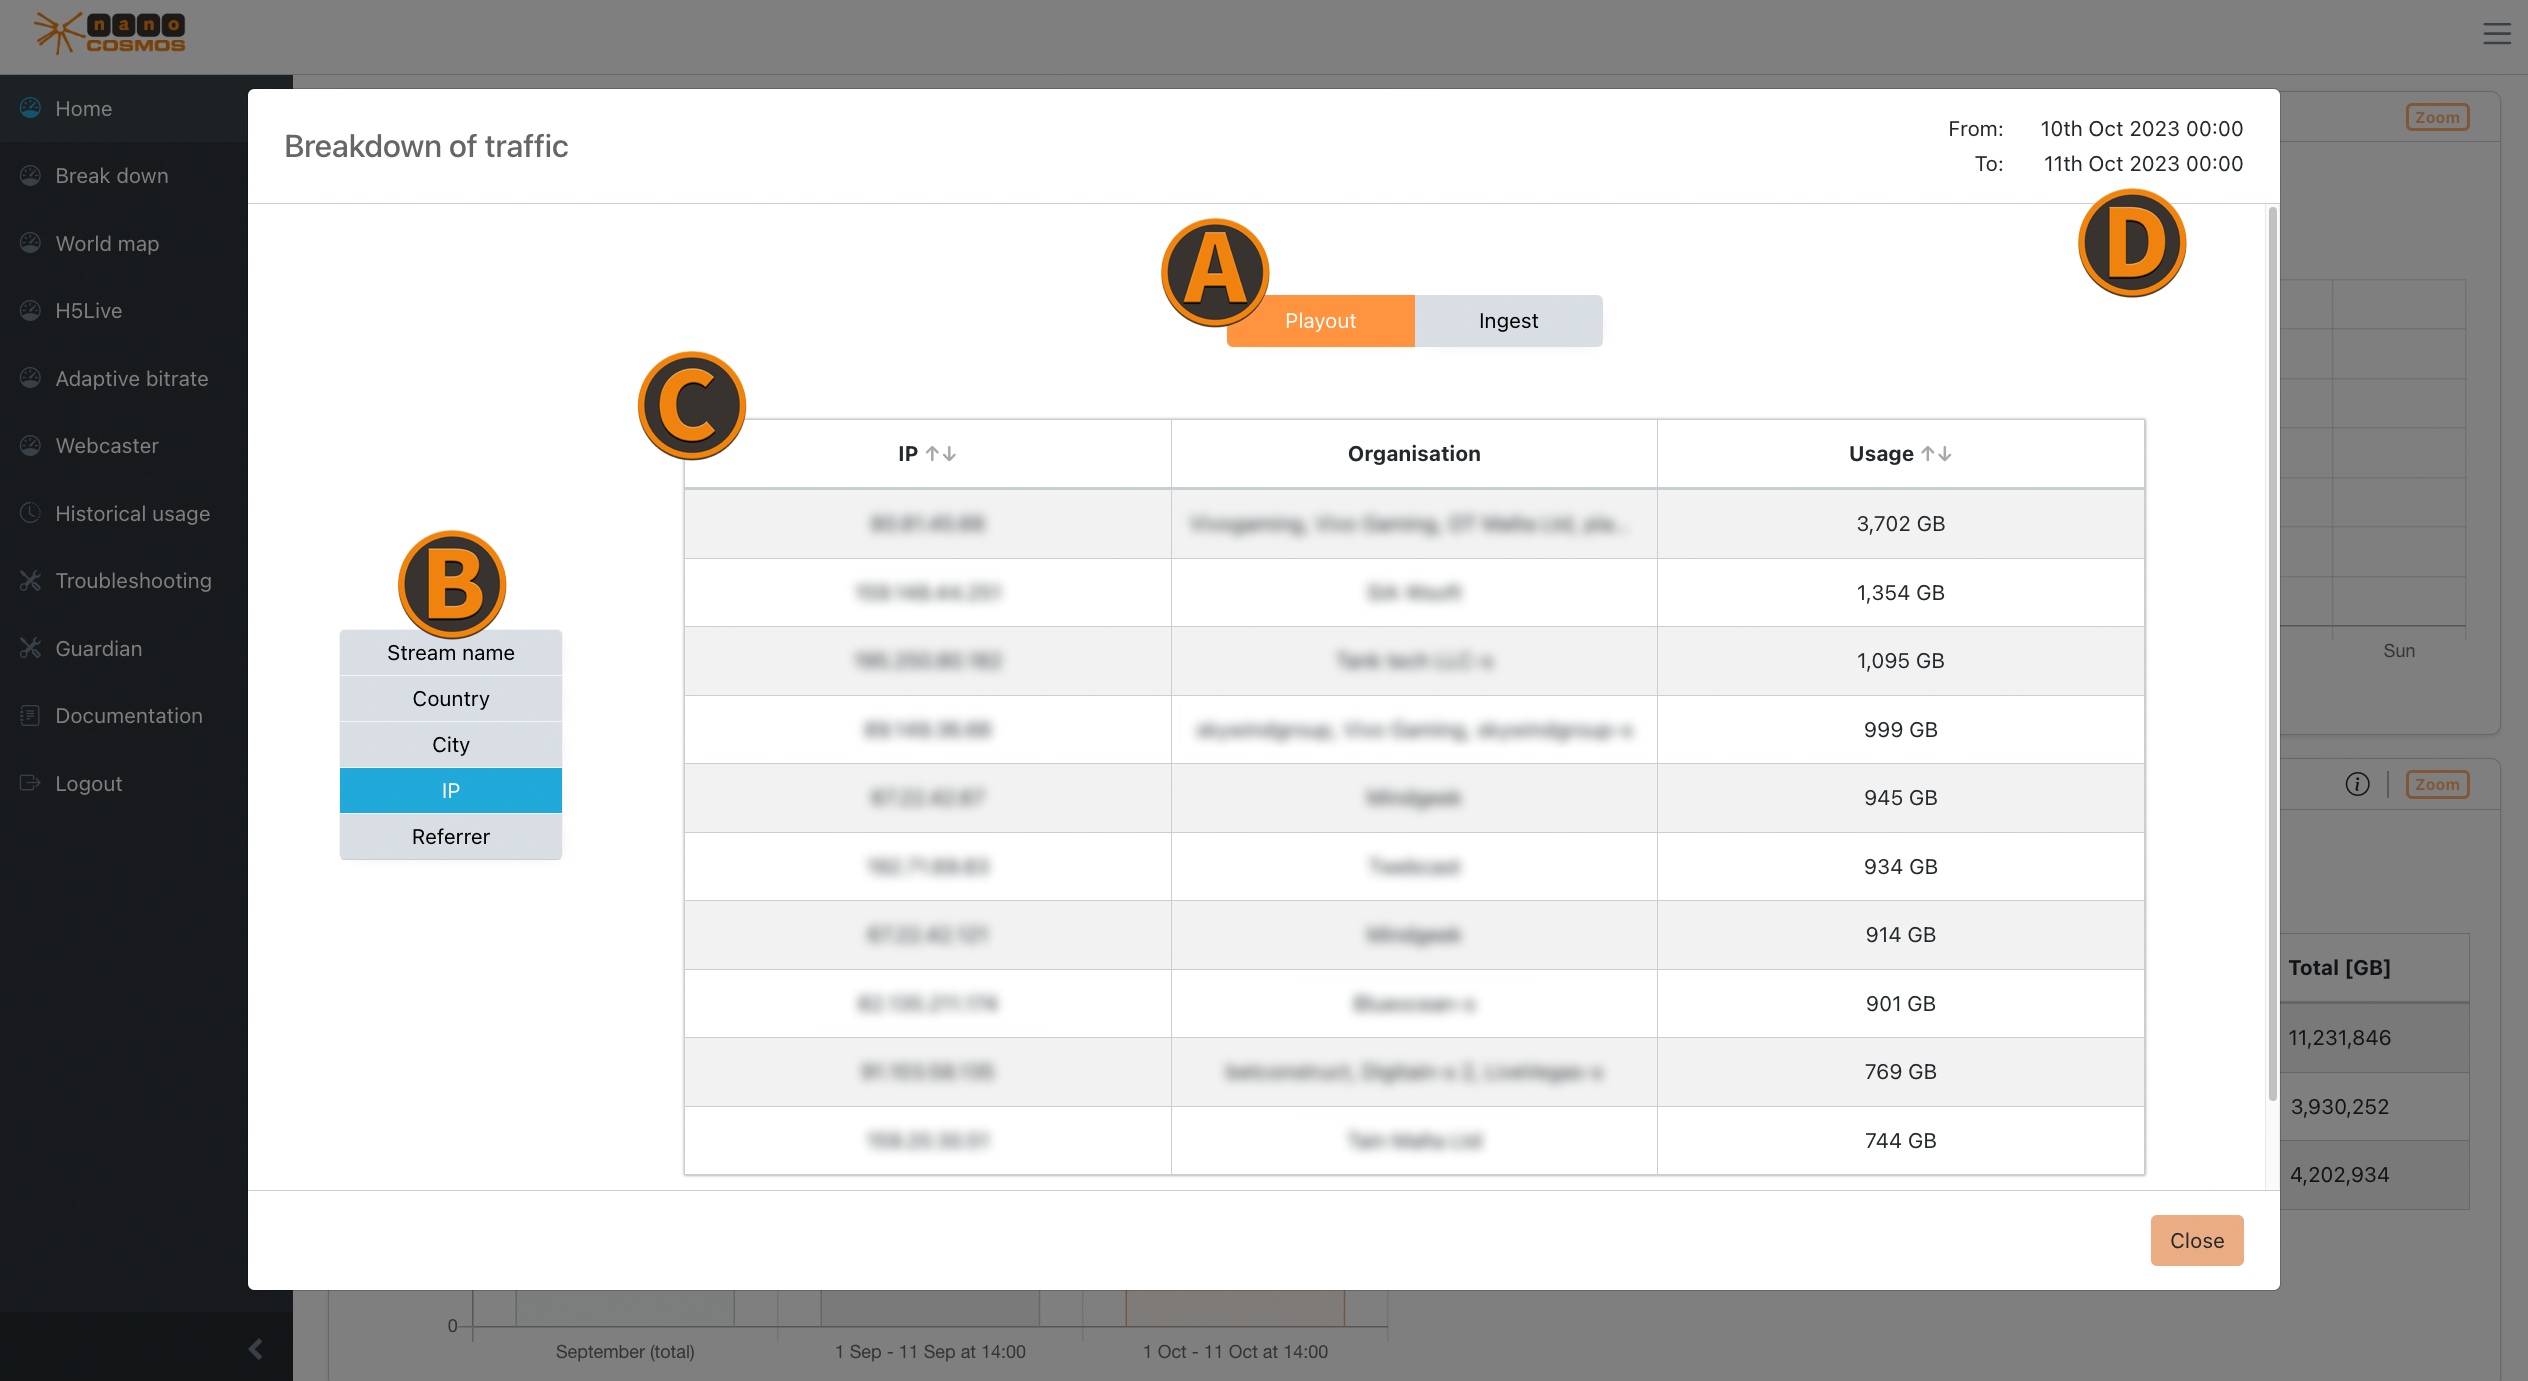 Screenshot: Zoom on Home
Usage/Traffic
Zooming into an usage diagram opens detailed information about the top 10 with biggest playout or ingest traffic within a specific time frame. (e.g. the top 10 countries with the highest stream data traffic)
Protocol Usage
The protocol usage shows the traffic for every protocol individually (e.g. H5Live, RTMP, HLS and H5Live Token).
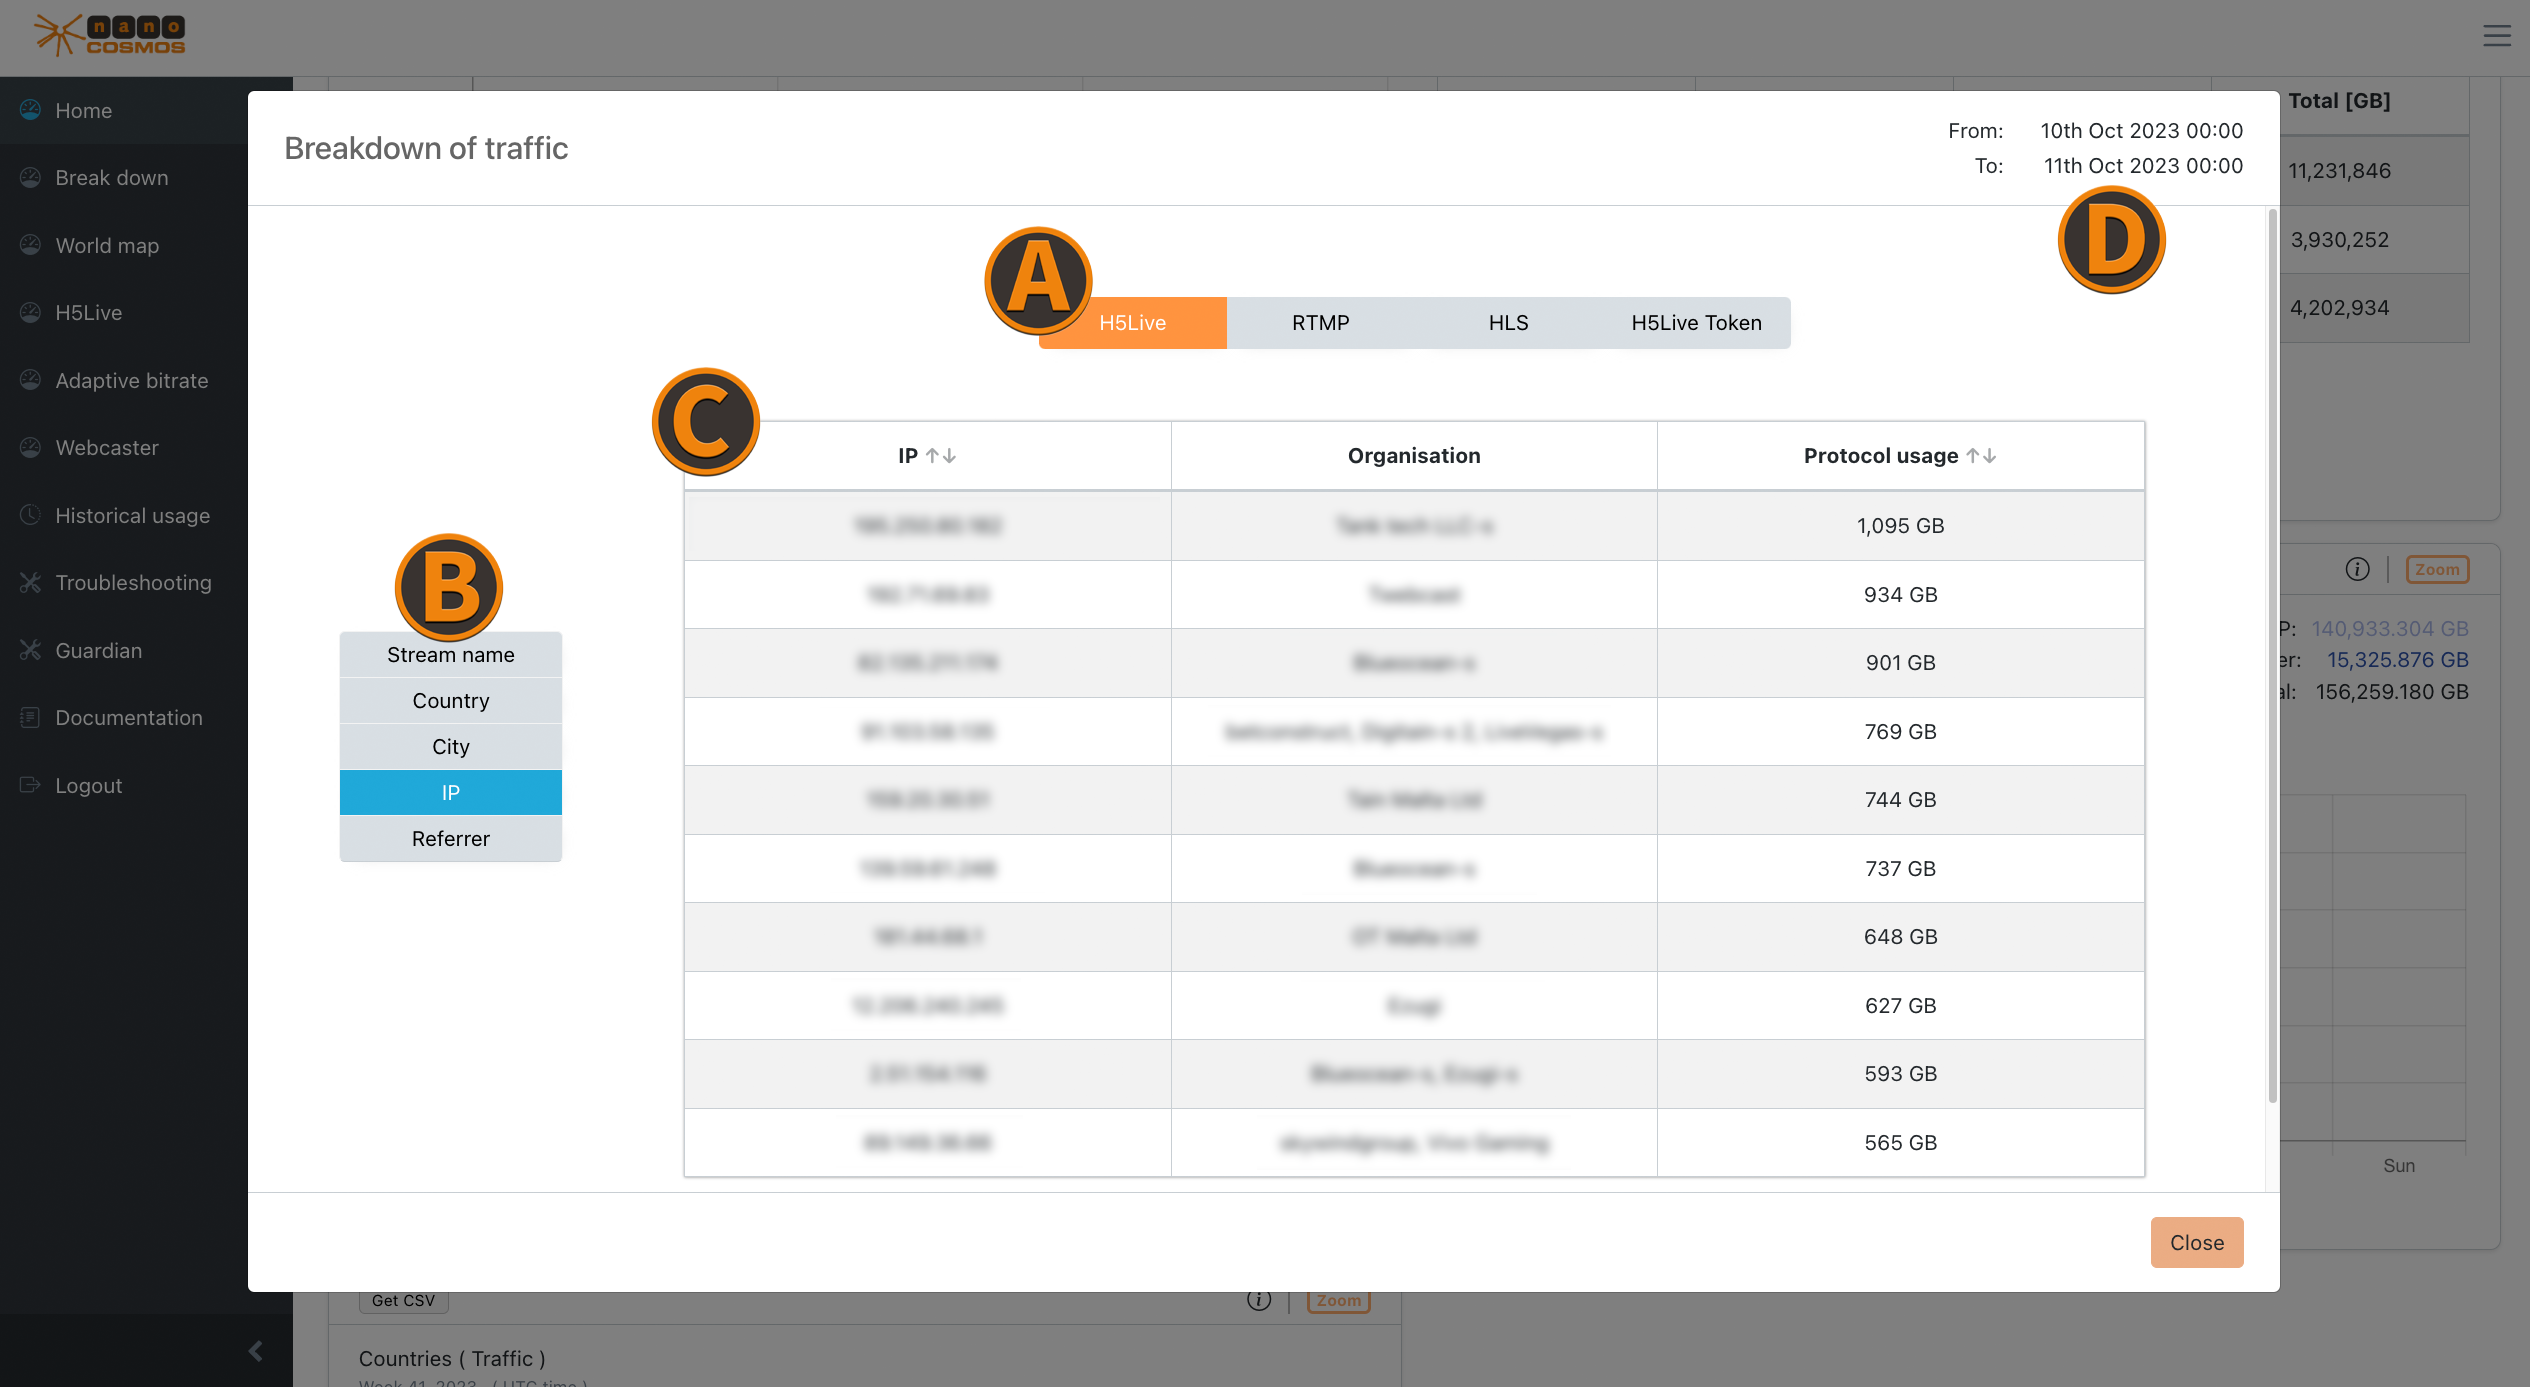 Screenshot: Zoom on Protocol Usage
Max Concurrent Viewer
The max concurrent viewer zoom table ranks by the top 10 results by their concurrent viewer counts for the chosen data feature. (e.g. the top 10 streams with the highest count of concurrent viewer)
Zoom on Worldmap
This Zoom/Breakdown menu is shown when clicking on a marked country in the Zoom Region View or Country View. It represents a more detailed overview of this countrys Top 10 results by the selected metric category and filter option.
 Screenshot: Zoom on Worldmap
Playout/Ingest (Usage)
Like the usage details from home tab, but only for the selected country.
Aggregated Metrics
The following aggregated metrics provide more insight for different use cases regarding your stream quality:
Buffering Play Ratio
- the ratio between stream buffering and fluent play back (ranked by highest ratio)
Playtime
- the average and total play back time (ranked by highest average play back time)
Latency
- the average and total latency from ingest to playout (ranked by highest latency)
ABR
- successfull profile switch count
- playtime per device per profile
- viewers per profile
Zoom on H5Live
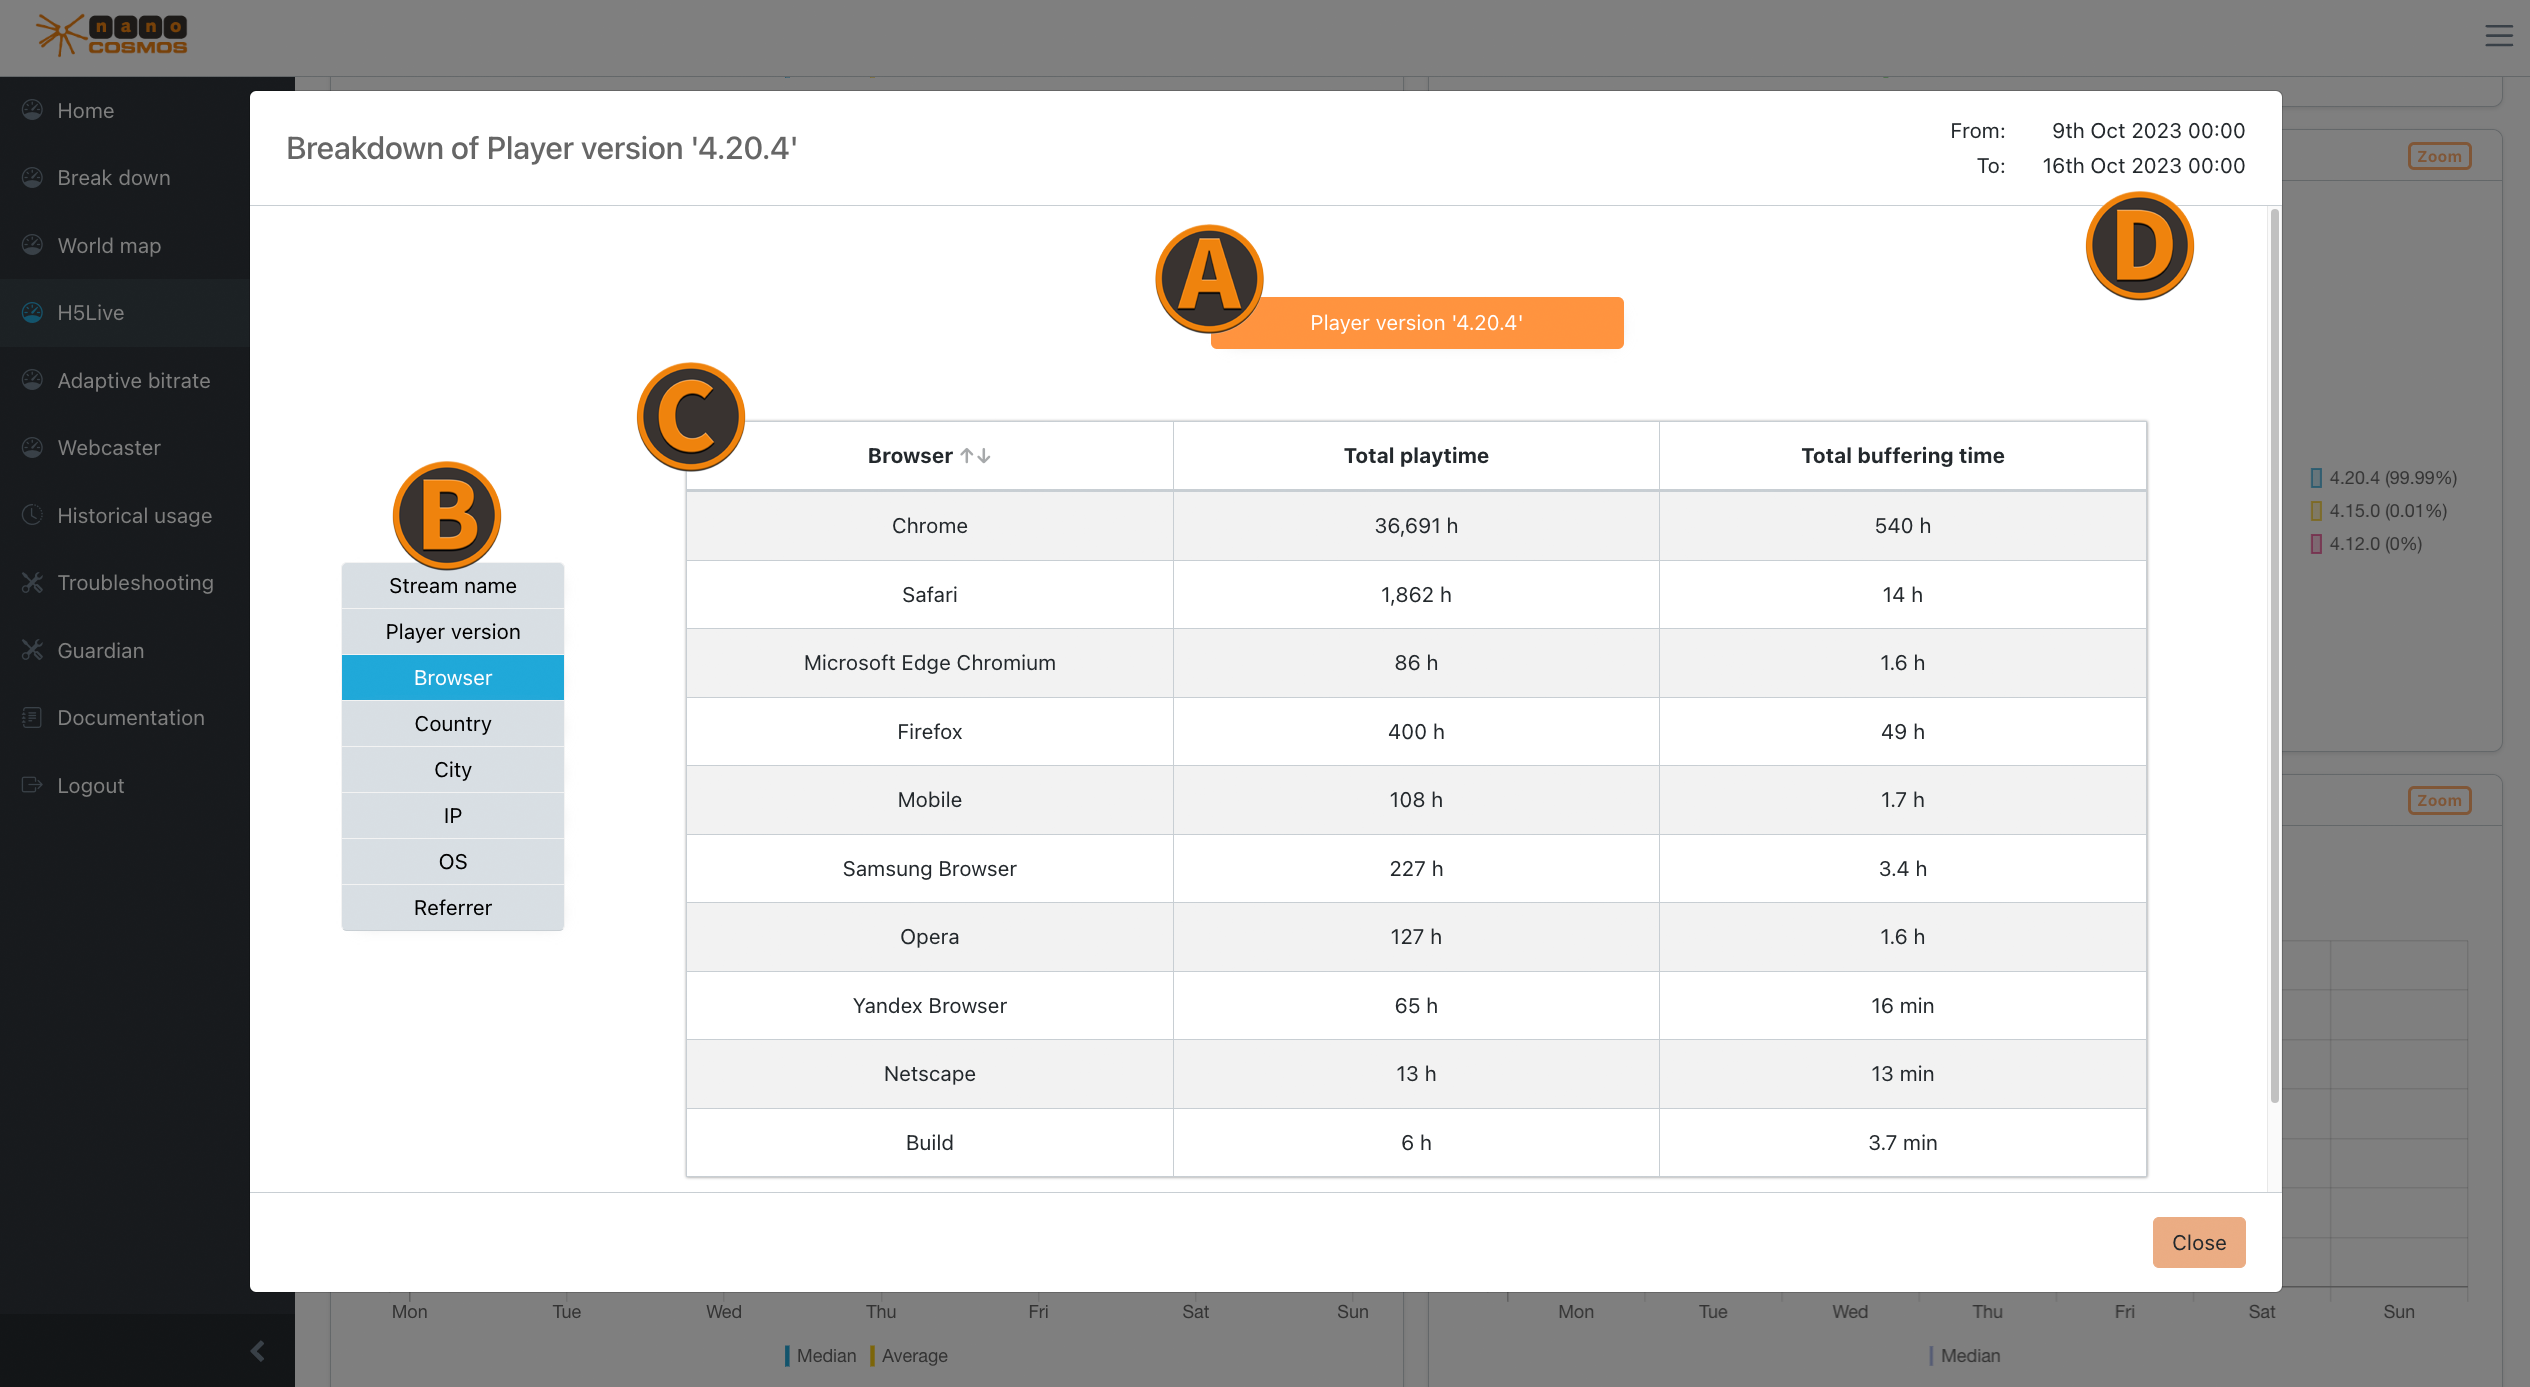 Screenshot: Zoom on H5Live
Playback Count
Shows the playback count per OS or per browser.
Player Versions
You can check detailed information about the use of different H5Live player versions, ranked by the most occuring player events. (e.g. pause, play, stop)
Player Startup Times
Here you can find details about the initial loading times of the player, ranked by the longest average first.
Player Loading Counts
This insight provides information about the frequency of player loading events. Note, that each country is viewed separately.
Status/Error Codes
Check more defined details on occuring status and error codes, ranked by their counts.
Reasons for Stopping
Use this details to see which stopping reasons the players had, ranked by how often they occur
Aggregated Metrics
The following aggregated metrics provide more insight for different use cases regarding your stream quality:
Latency
- average and total latency
Buffering Ratios
- average and total buffering ratios
Zoom on ABR
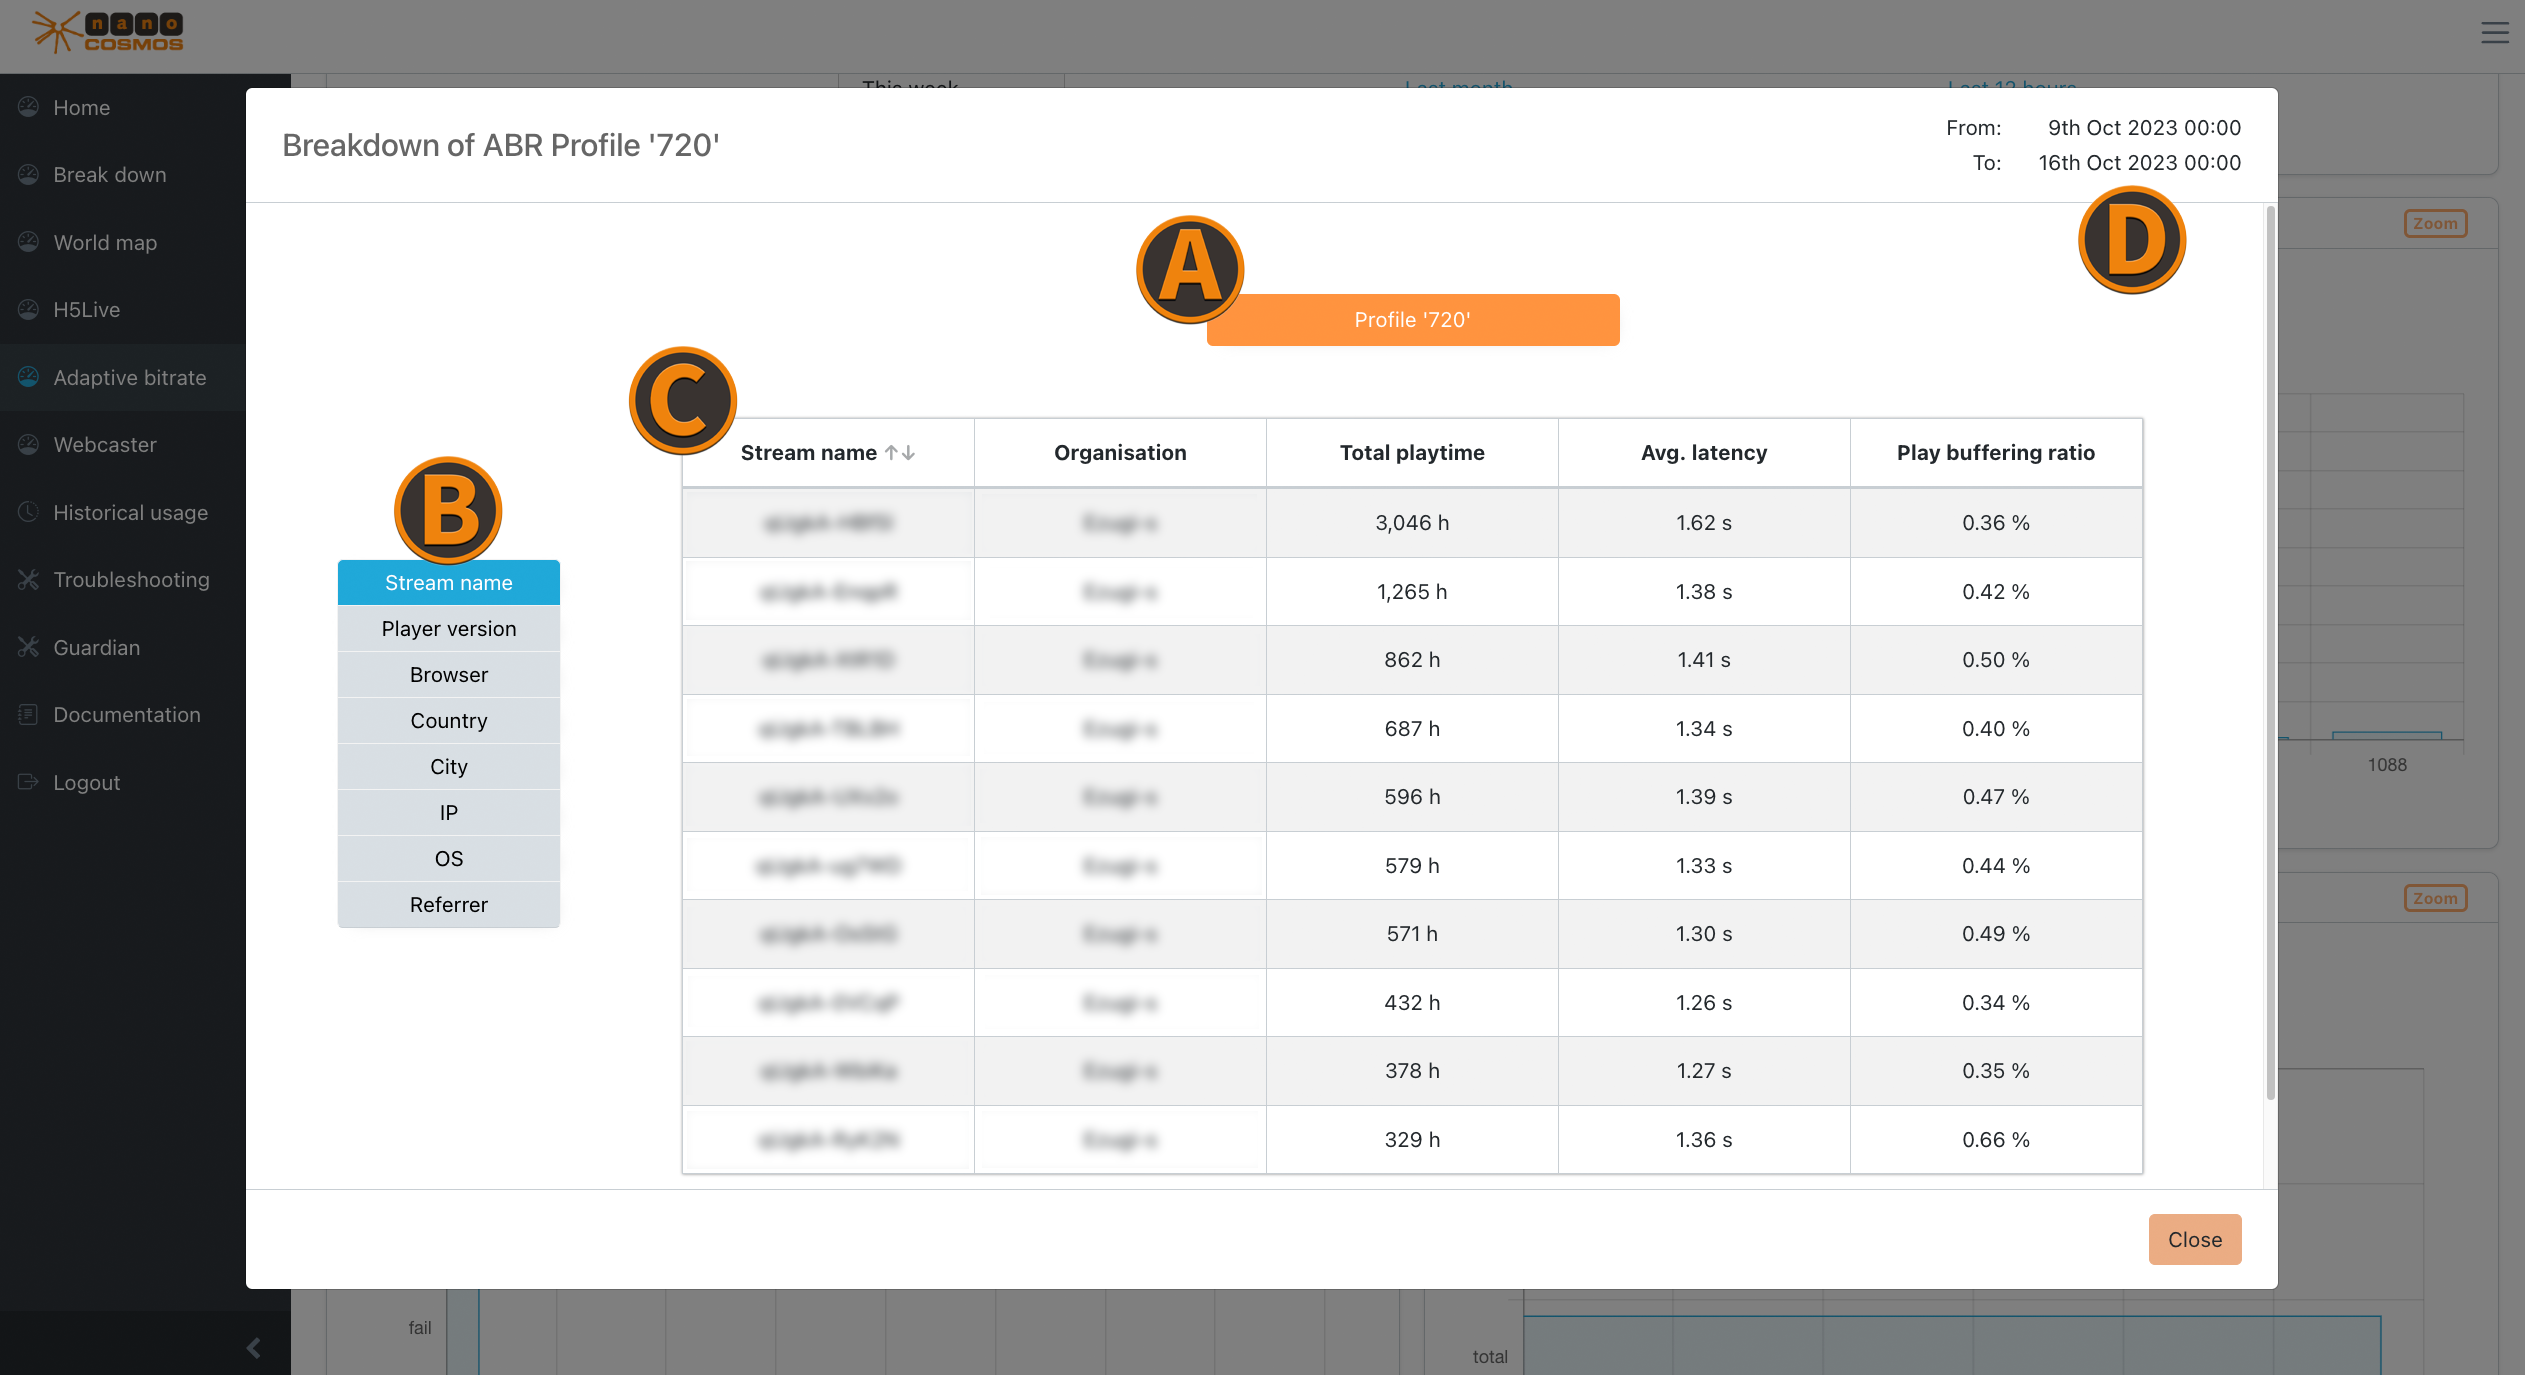 Screenshot: Zoom on ABR
Profile Details
The ABR profiles represent different resolutions for the playback, based on the video height (e.g. 360p, 720p, 1080p) :
Playtime per Profile
- playtime per resoultion, ranked by longest playtime
Viewer Count per Profile
- active viewers per profile (not concurrent viewers)
Profile Switch Details
Insights for the ABR profile switches provide useful information to determine general stream or bandwidth quality:
Success Rate
- relation between successed and failed up and down profile switches
Up and Down Switches
- more distinct insights of different profile switch categories (e.g. only up or down switches)
Zoom on Webcaster
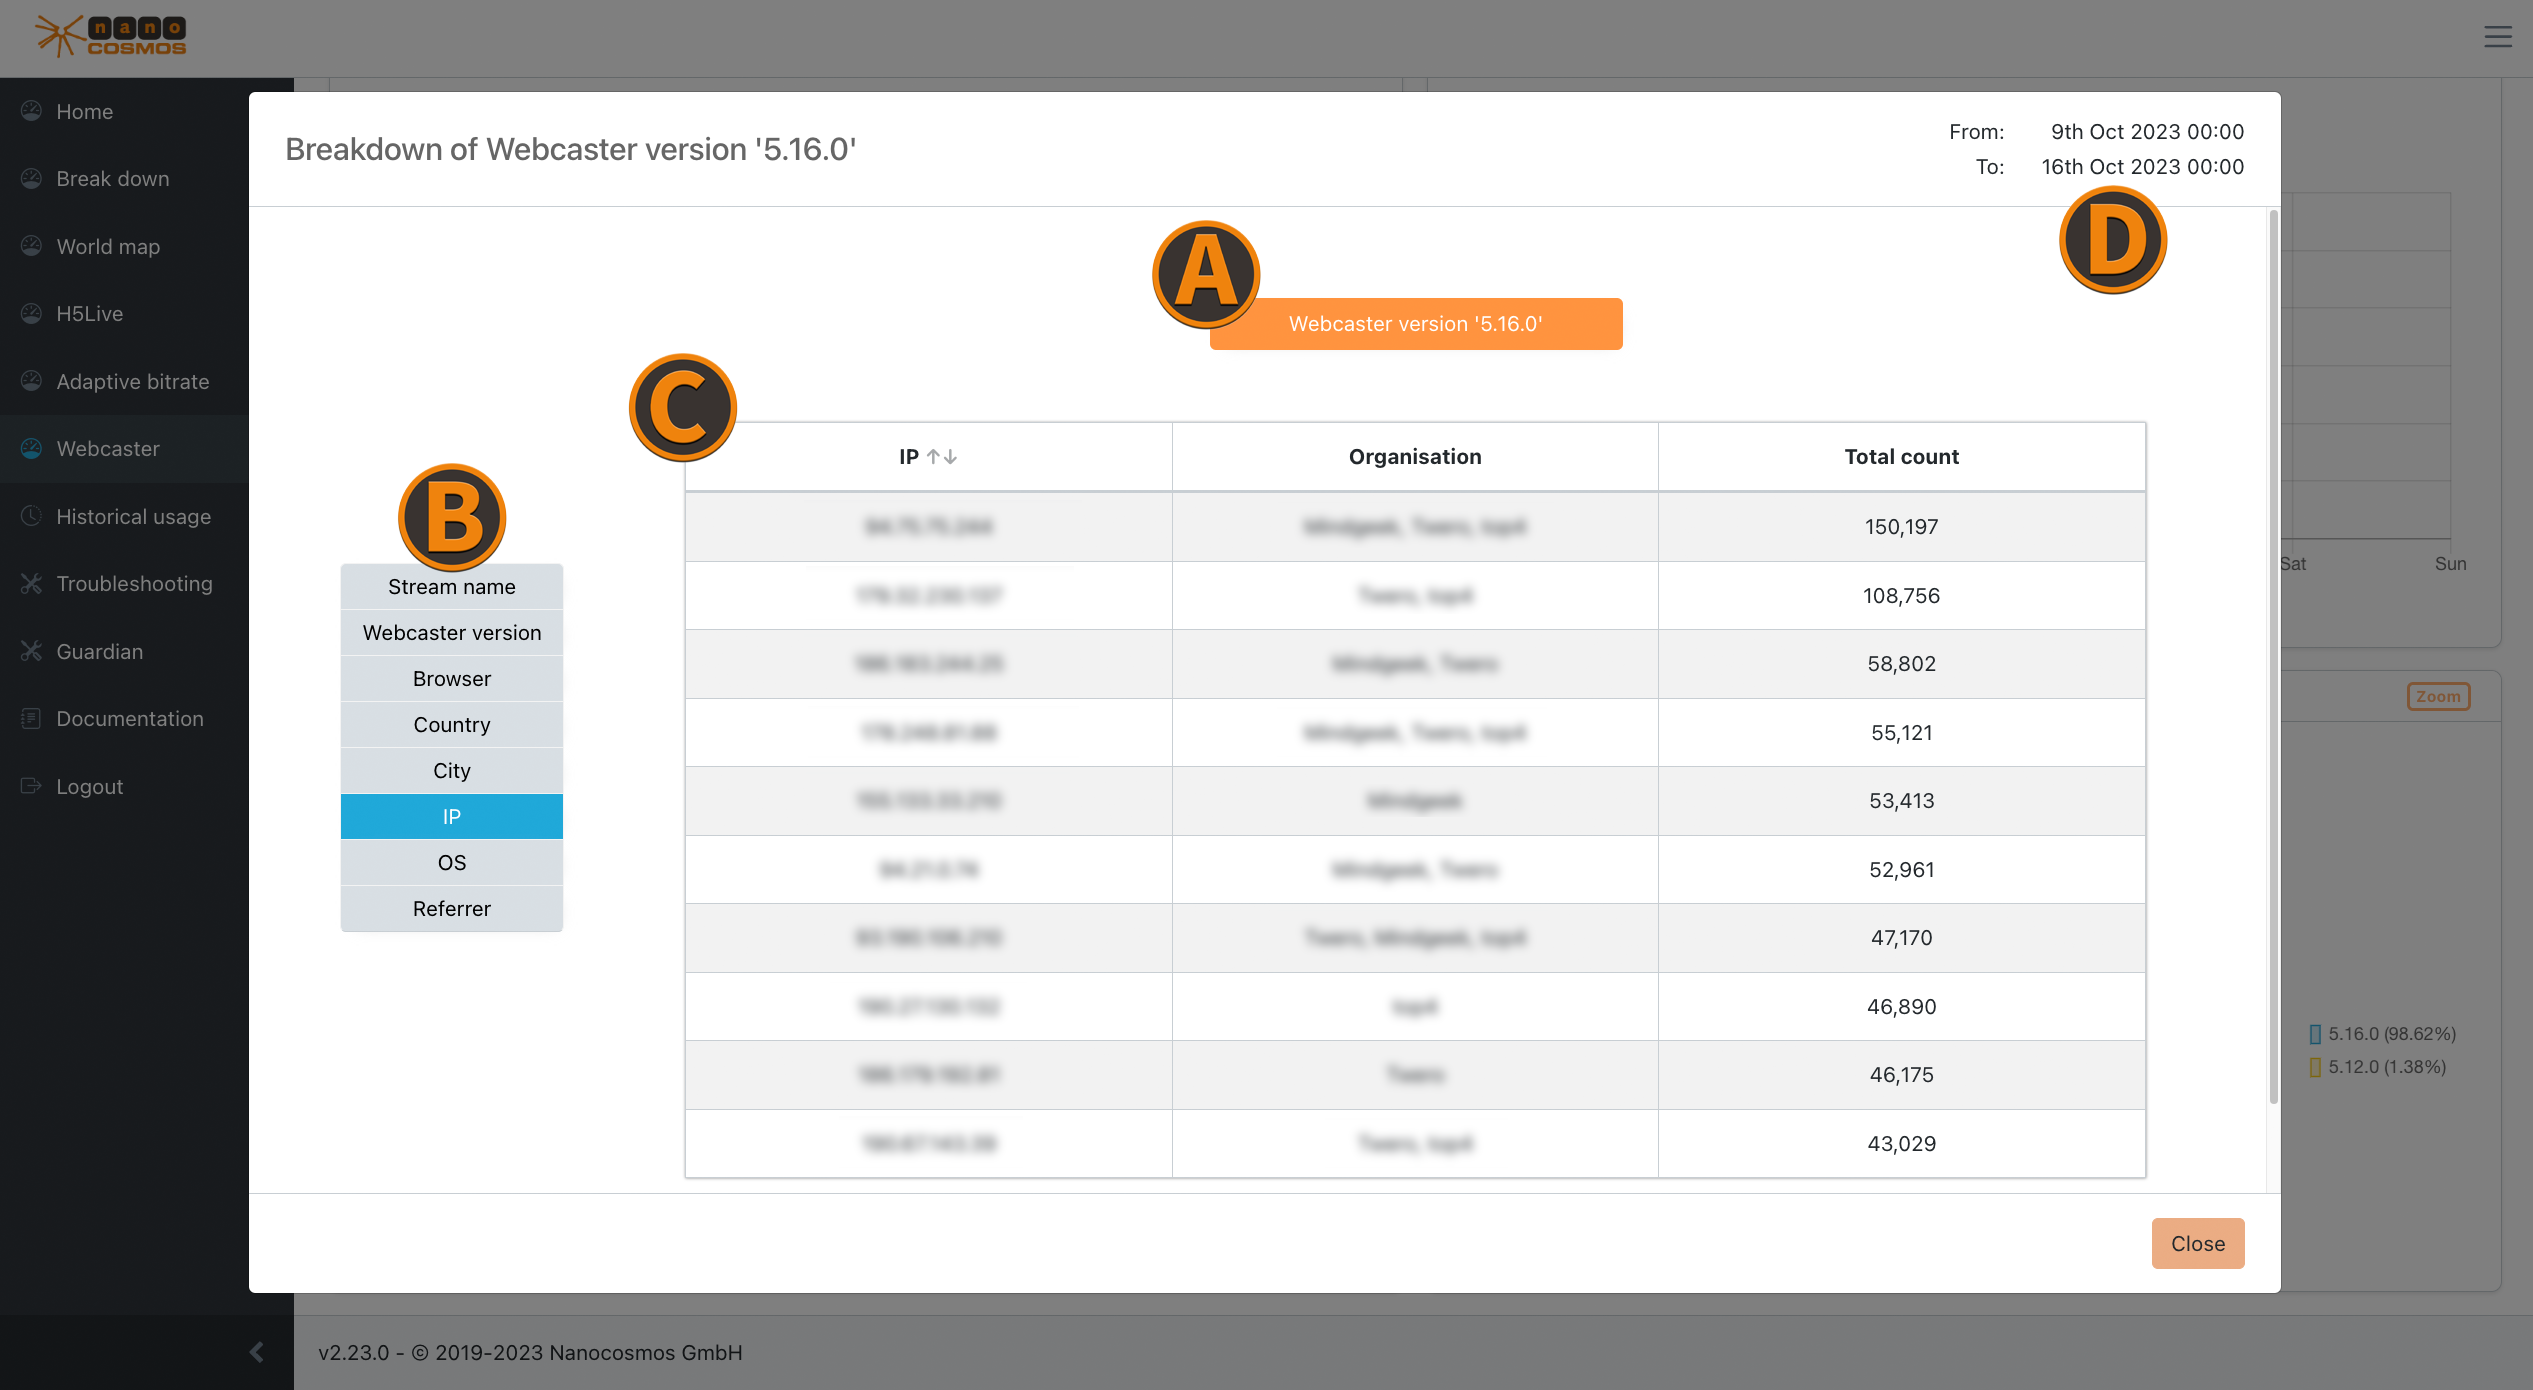 Screenshot: Zoom on Webcaster
Webcaster Publishes
The counts of publishes which are using the our webcaster.
Bitrates
The average and median bitrates for video and audio data helps to determine bandwidth fluctuations.
Error/Status Codes
This widget provides insights for different status and error codes of the webcaster, which get ranked by their frequency.
Broadcasting Times
These broadcasting times represent the median and average time ranges when the webcaster send a broadcasting signal.
Reasons for stopping
This widget lists all the stopping counts of the streams and specific stopping reasons.
Versions
More details about the different webcaster versions, ranked by their counts of use.