Troubleshooting
The trouble shooting page helps to investigate stream or user specific metrics across the streaming experience from stream ingest to the playout at the enduser. With this feature you have a complete transparent view at your streams, which helps you to find potential problems and be more capable of solving them faster.
To begin, please sign in to the Analytics Dashboard using your nanoStream Cloud/Bintu account credentials.
If you have not created an account yet, you can sign up or reach out to our dedicated sales team via the contact form or by sending an email to sales(at)nanocosmos.de.
Access
Access to the Trouble Shooting page is available for every nanoStream Cloud customer.
Displaying Stream Playout information will require a business upgrade to sent your H5Live Player metrics to our Analytics backend. Please contact sales(at)nanocosmos.de for business details.
Time Picker
The time picker declares the time period in which you will query for available metric results. Use to " Set to Now" button the to automatically update to the current time.
Date and time values are interpreted as UTC, an offset to your local timezone needs to be considered.
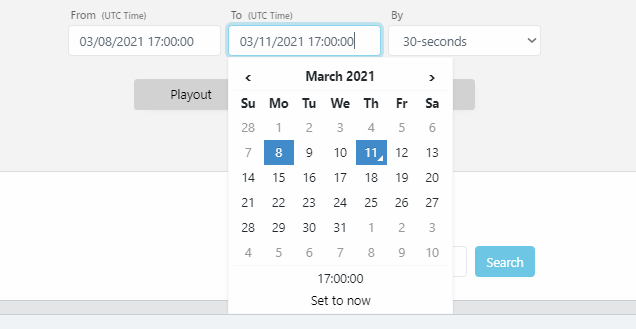 Screenshot: Time Picker
Playouts
After selecting a specific time period you are asked to enter an IP address or an user ID to access playout statistics about all streams that this user retrieved. You will then be able to select one out of the 5 newest playouts based on their start date. To view more than these 5 results you need to adjust the time range accordingly. We also implemented support for currently running playouts.
Only organizations with player metrics option enabled will be able to see the items in this data group.
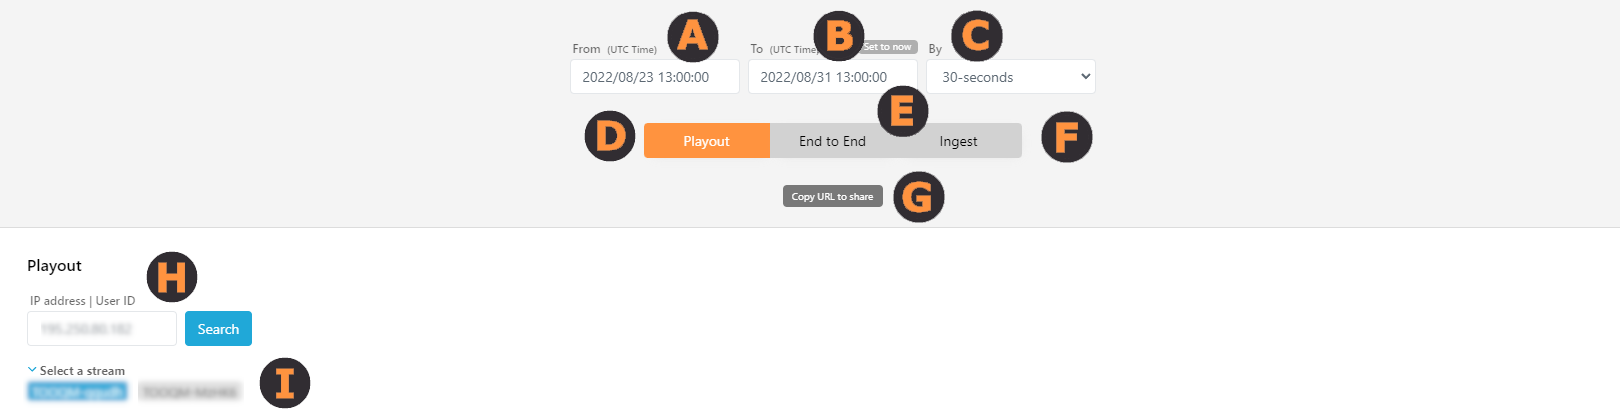 Screenshot: Playout Time Picker
(A) From (UTC Time) the start of the time range to search in.
(B) To (UTC Time) the end of the time range to search in.
(C) By indicates the time interval granularity. It can be 30 seconds or 1 minute.
(D) Playout tab which selects to view playout statistics. Playout statistics for all streams in the selected time period are retrieved.
(E) End to End tab which selects to view both playout and ingest statistics in the same page. Playout and ingest statistics for all streams in the selected time period are retrieved.
(F) Ingest tab which selects to view ingest statistics. Ingest statistics for all streams in the selected time period are retrieved.
(G) Copy URL to share will copy the current page setup to clipboard. Users can send this URL to nanocosmos support for further troubleshooting help.
(H) IP address/user ID specifies either the IP address used in client playouts or user IDs to search for related streams.
To make this work with user IDs, you have to assign IDs to your users beforehand and also transmit that to the player API.
(I) Select a stream shows all streams that has a playout related to the IP address or user ID set earlier.
Stream Playout Information
If there are metrics available for the selected IP/ user ID within the stated time period, a list of streams viewed by this user is shown. Select the desired stream name to see a list of all playouts for this stream. After you selected a playout more detailed information are shown. Define the time interval with the slider to zoom into streams with a longer duration or to focus on specific parts of the stream. At this point you can synchronize with the corresponding ingest data of the playout on the right side.
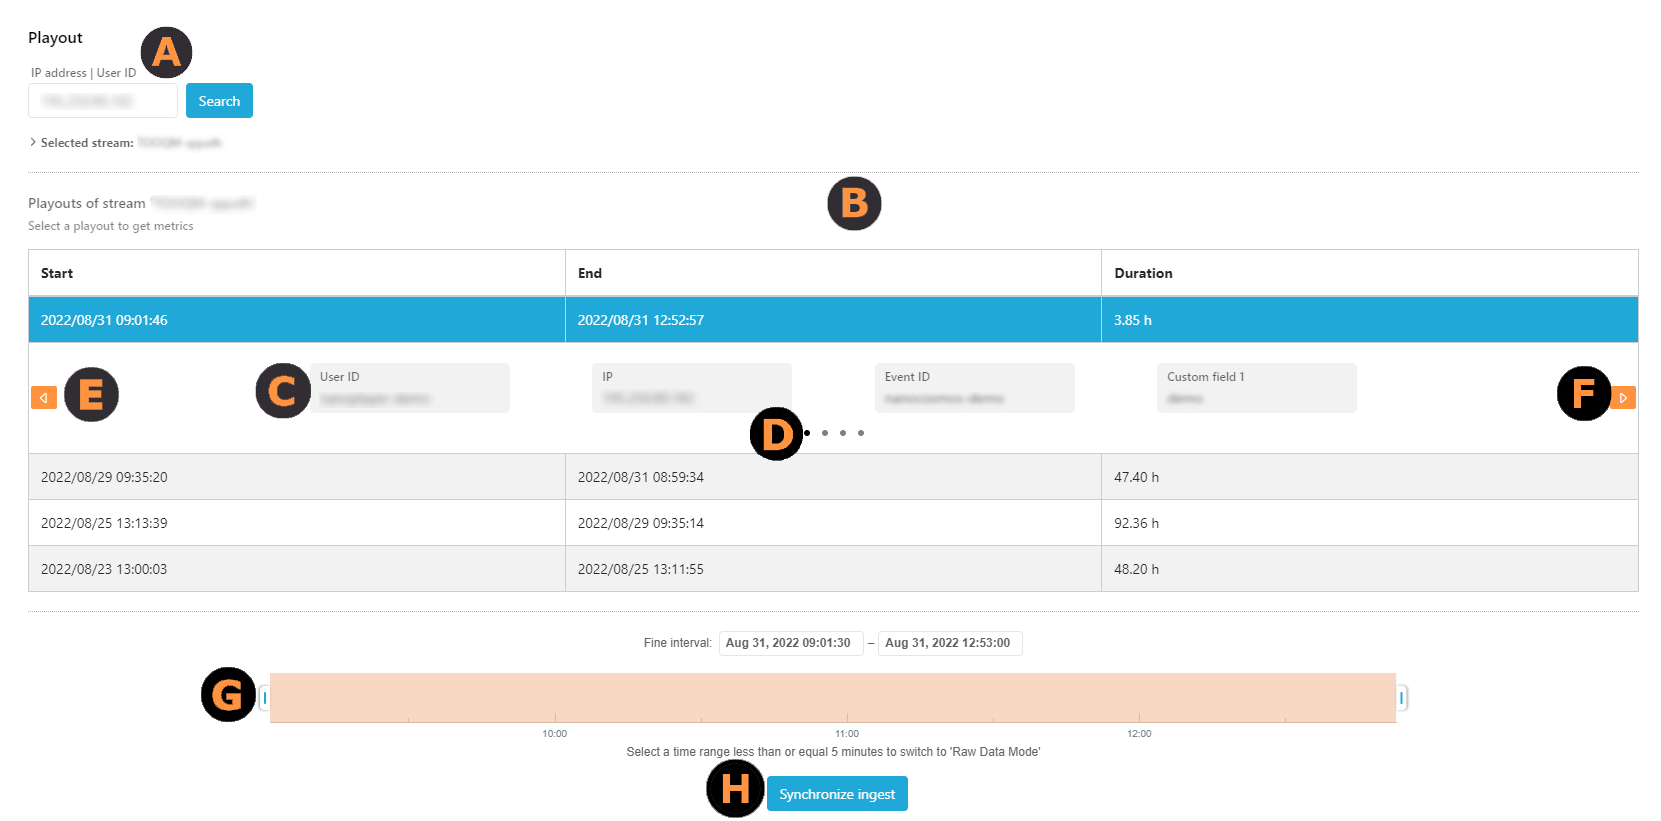 Screenshot: Playout Stream Information
(A) Playouts of selected stream name.
(B)
Startindicates the start of playout.Endindicates the end of playout.Durationindicates playback duration.
(C) Groups of meta-data information are shown related to the stream.
The meta-data includes:
User ID- user ID.IP- client IP address used for playout.Event ID- event ID.Custom field 1- custom field1.Playout ID- internally generated unique ID.H5Live player version- version of nanoplayer used.Device- type of device used.Referrer- webpage that hosts the nanoPlayer.Country- location of user.City- location of user.Resolution width- width of video stream in pixels.Resolution height- height of video stream in pixels.OS- OS used.OS version- OS version.Browser- web browser used.Browser version- browser version.
(D) This tab shows which group of meta-data information is being shown at the moment and how many groups are available.
(E) (F) Click to switch between meta-data information.
(G) This time slider can be used to define the time interval, allowing to zoom into streams with a longer duration or to focus on specific parts of the stream.
(H)
Synchronize ingest gives the ability to synchronize the currently selected playout with the corresponding ingest data group. In this selection, the playout data group is shown on the left side while the ingest data group is shown on the right side. This is same as selecting the End to End data group.
If an user reloads the page of a stream, it will be accounted as a new playout.
If you set the visible time range to under 5 minutes, you switch from data aggregation mode into raw data mode. Therefore you will get exact datapoints at the given time.
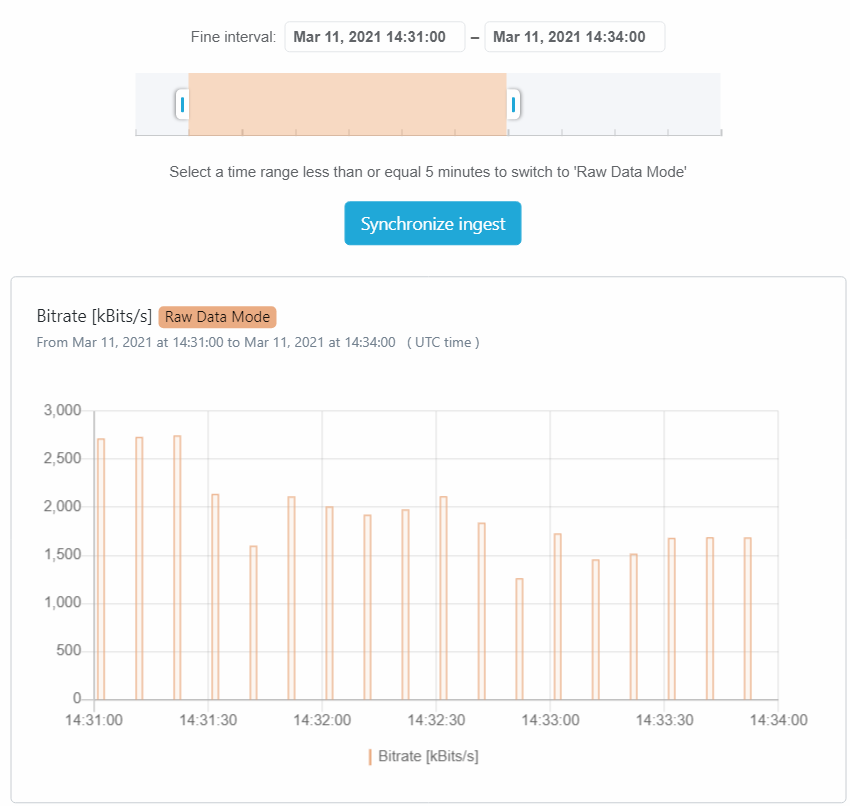 Screenshot: Troubleshooting Raw Data Mode
Visualizations
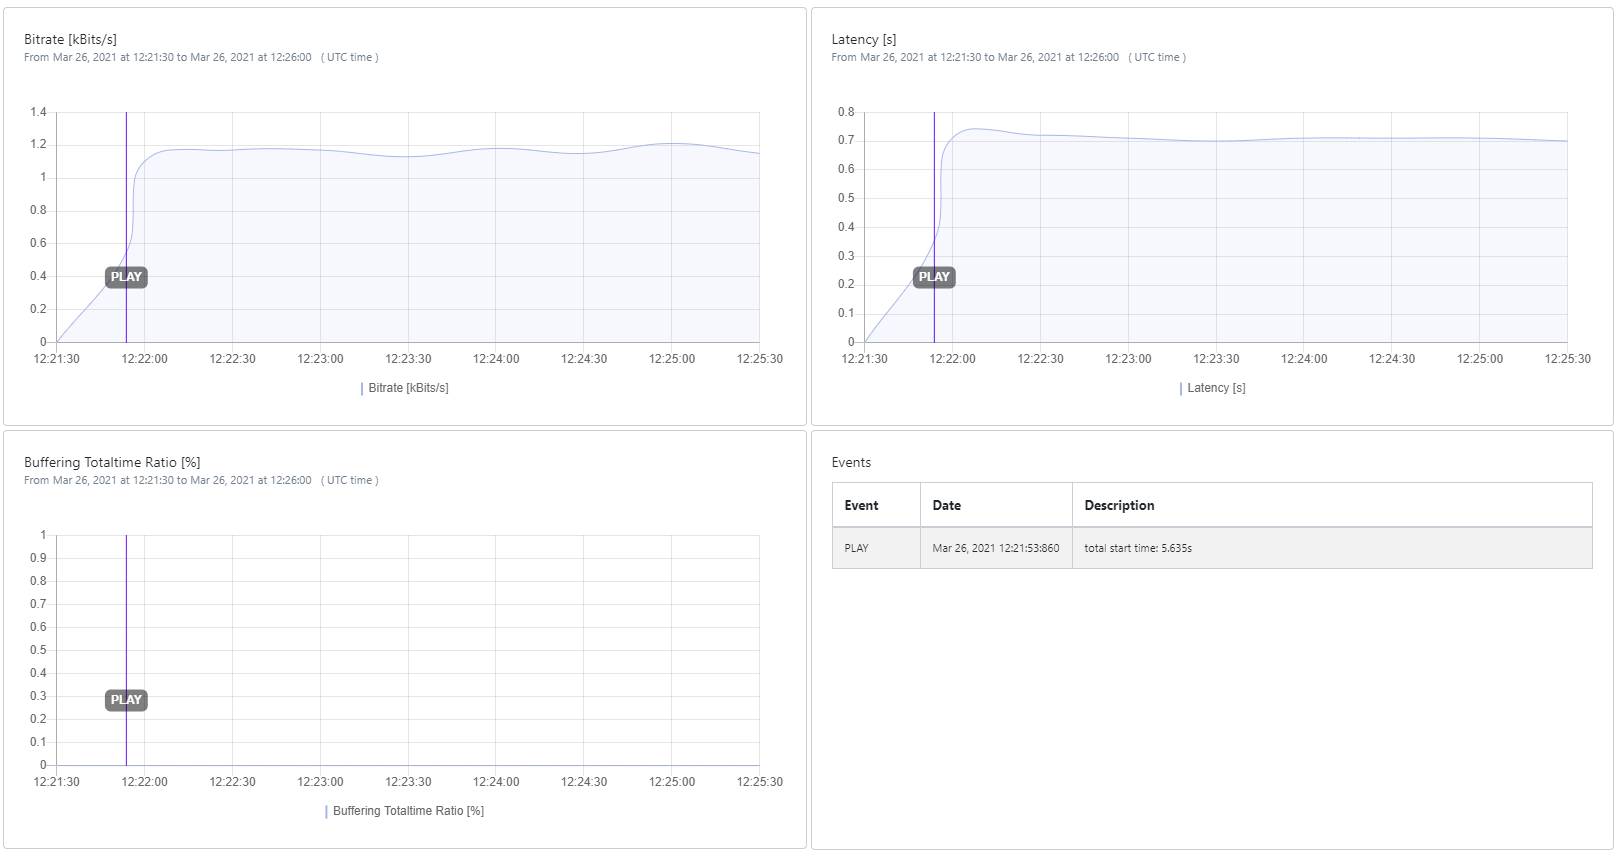
This area shows charts for various player metrics.
 Screenshot: Playout Media Information
Bitrate [kBits/s]:
The retrieved bitrate on the client side at a specific time. Purple lines symbolize events which are also listed in the Events table.
Latency [s]:
The latency from ingest to playout. Purple lines symbolize events which are also listed in the Events table.
Buffering Totaltime Ratio [%]:
The ratio between buffer and playback duration.
A ratio of 0% means no buffering and a ratio of 100% means no playback was possible.
Events:
All events that occurred in the selected playout.
Ingests
The Ingest tab selects the ingest data group with all items described in detail next. Whether you have synchronized a corresponding playout or entered a valid, in the time period available stream name yourself, you will have access to ingest specific data, depending on the used protocol WebRTC or RTMP. You can see which protocol was used after entering a stream name right below the selection. We also implemented support for current running ingests.
 Screenshot: Troubleshoot Ingest
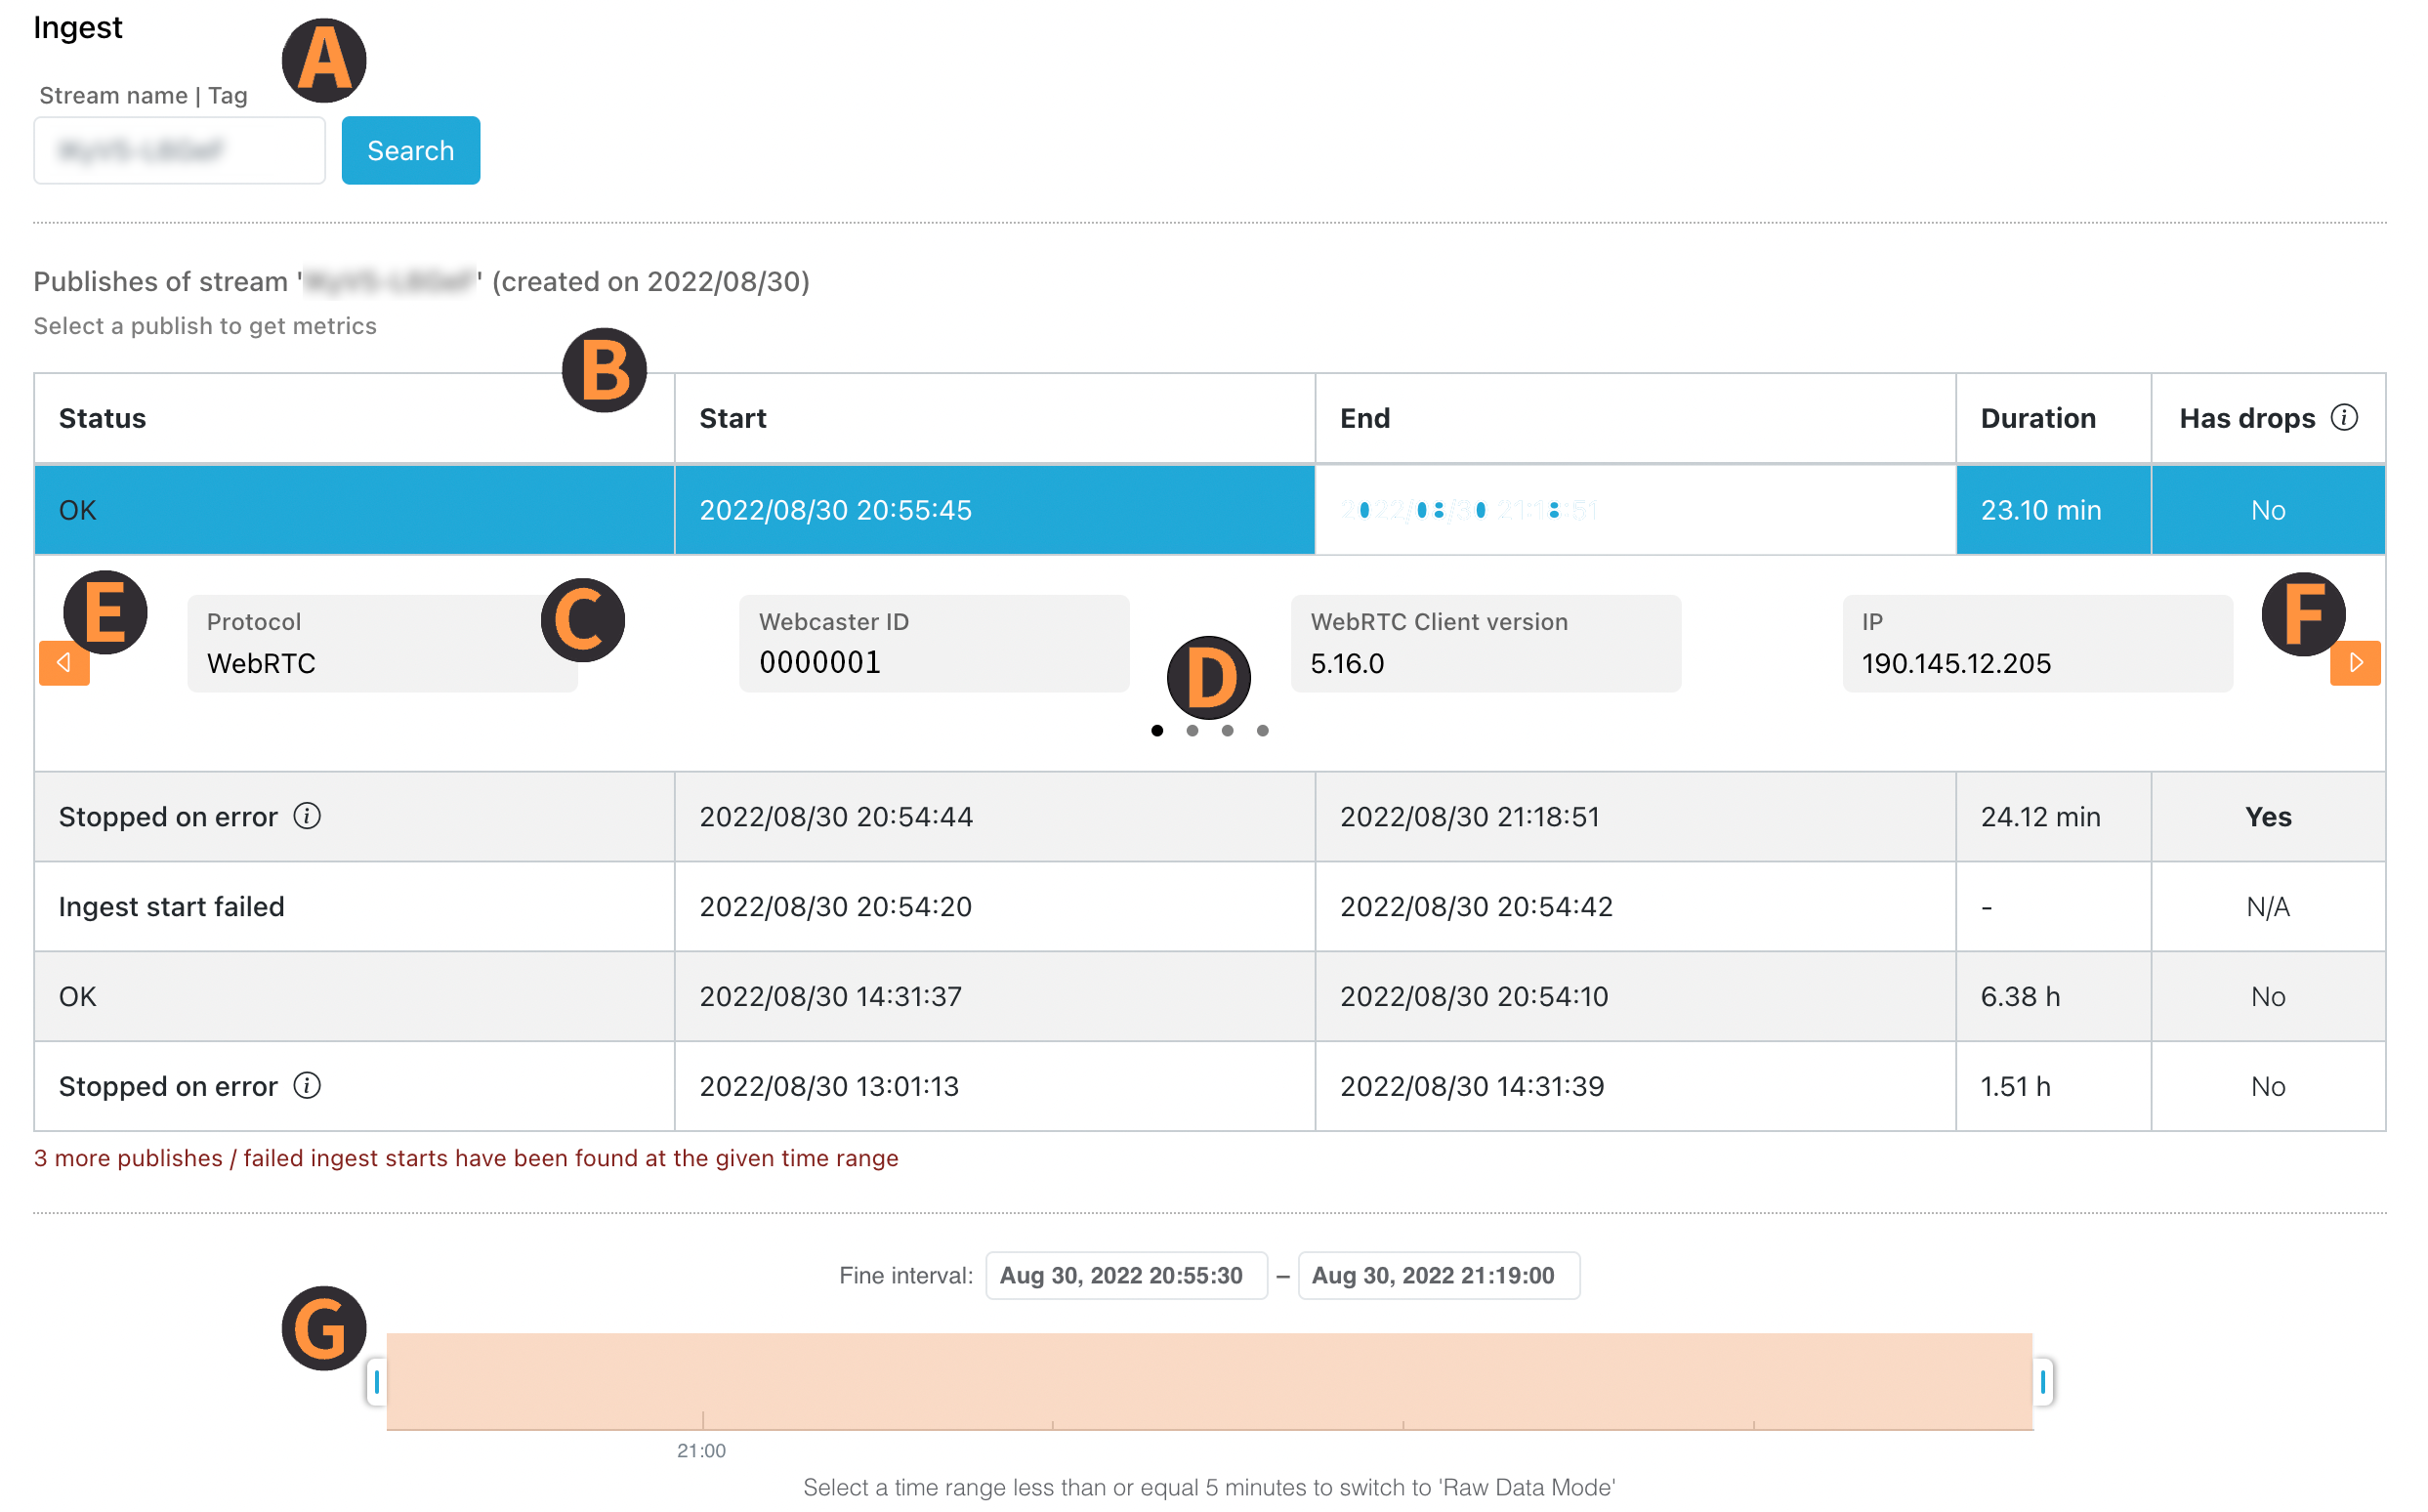
(A) Stream name indicates the stream name of interest.
(B)
Statusshows if the ingest was successful or failed due to an error.Startindicates the ingest start time.Endindicates the ingest end time.Durationindicates ingest duration.Dropsindicates if the ingest was interrupted.
Ⓒ
Groups of meta-data information are shown related to the stream. The meta-data includes :
-Protocol - streaming protocol used.
Data center- specific data center used for this ingest.Server- specific server in the data center used.IP- client IP from which the stream was ingested.Country- location of client IP.City- location of client IP.Resolution width- width of video stream in pixels.Resolution height- height of video stream in pixels.webcaster ID- ID of corresponding webcaster instance.
(C) This tab shows which group of meta-data information is being shown at the moment and how many groups are available.
(E) (F) Click to switch between meta-data information.
(G) This time slider can be used to define the time interval, allowing to zoom into streams with a longer duration or to focus on specific parts of the stream.
Stream Ingest Information
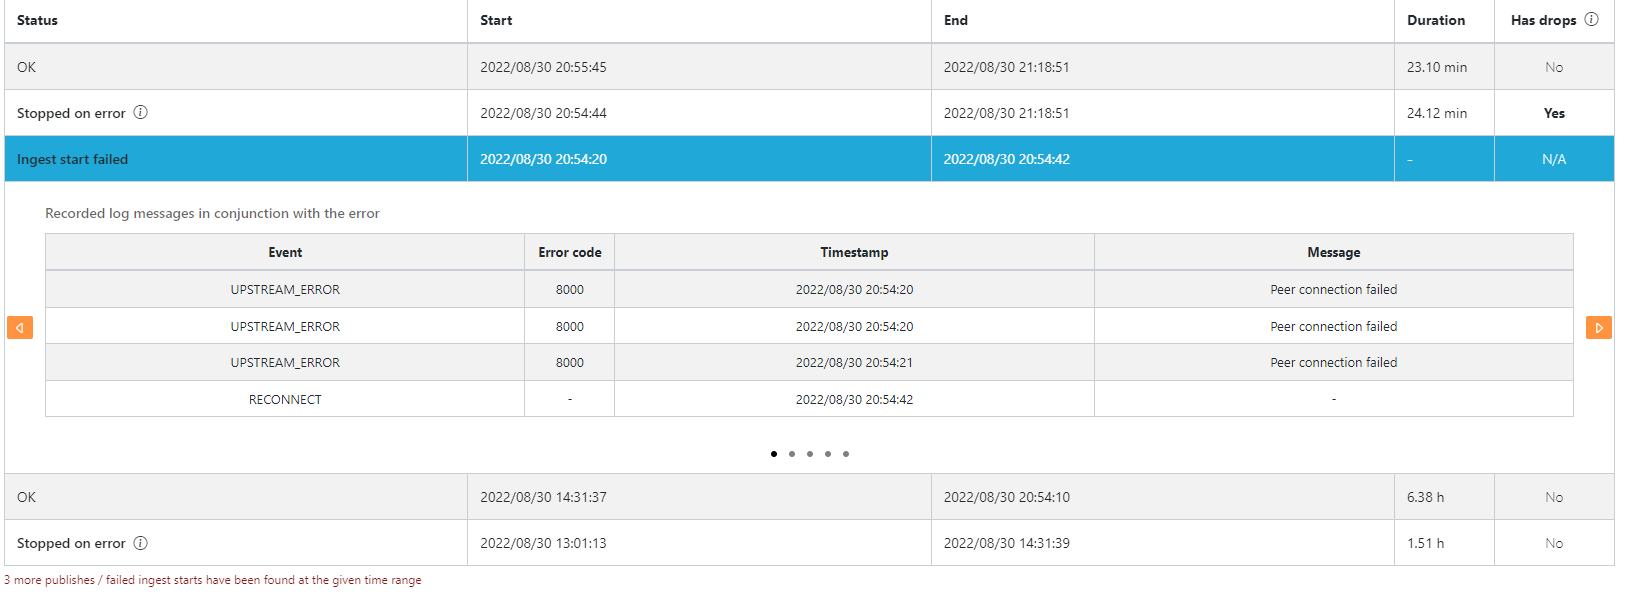
The list of ingests for the selected stream name contains both successful ingest tries and ingest failures within the chosen time range. You can click on a specific ingest to get more details, regarding error message, error codes or additional meta information.
 Screenshot: Troubleshoot Ingest Status
Visualizations
Define the time interval with the slider to zoom into streams with a longer duration or to focus on specific parts of the stream. The results you get for the ingest stream name are also sorted by newest first as for the playouts. Selecting a time period auto-refreshes the statistics below.
RTMP Ingests
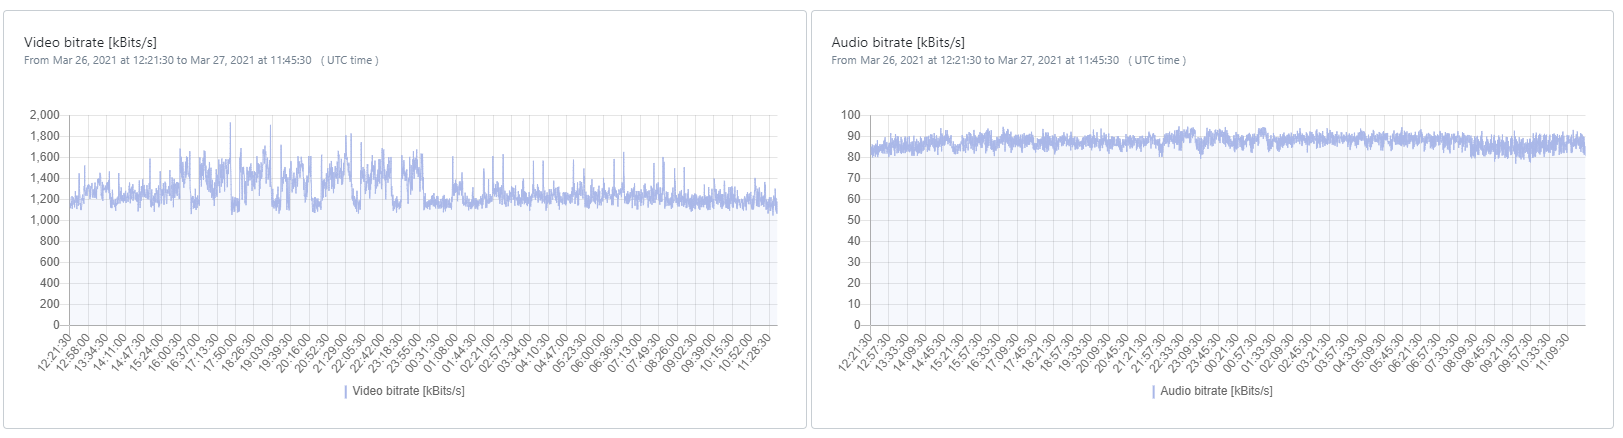
Ingests using RTMP only provide metrics about video and audio bitrates.
 Screenshot: Troubleshoot Ingest RTMP
Video bitrate[kBits/s]: Video bitrate of the ingested stream.Audio bitrate[kBits/s]: Audio bitrate of the ingested stream.
WebRTC Ingests
Ingests using Web Real Time Communication are providing additional insights to framerate, encoding and package delivery.
To have WebRTC metric data available for the Troubleshooting page, they need to be enabled.
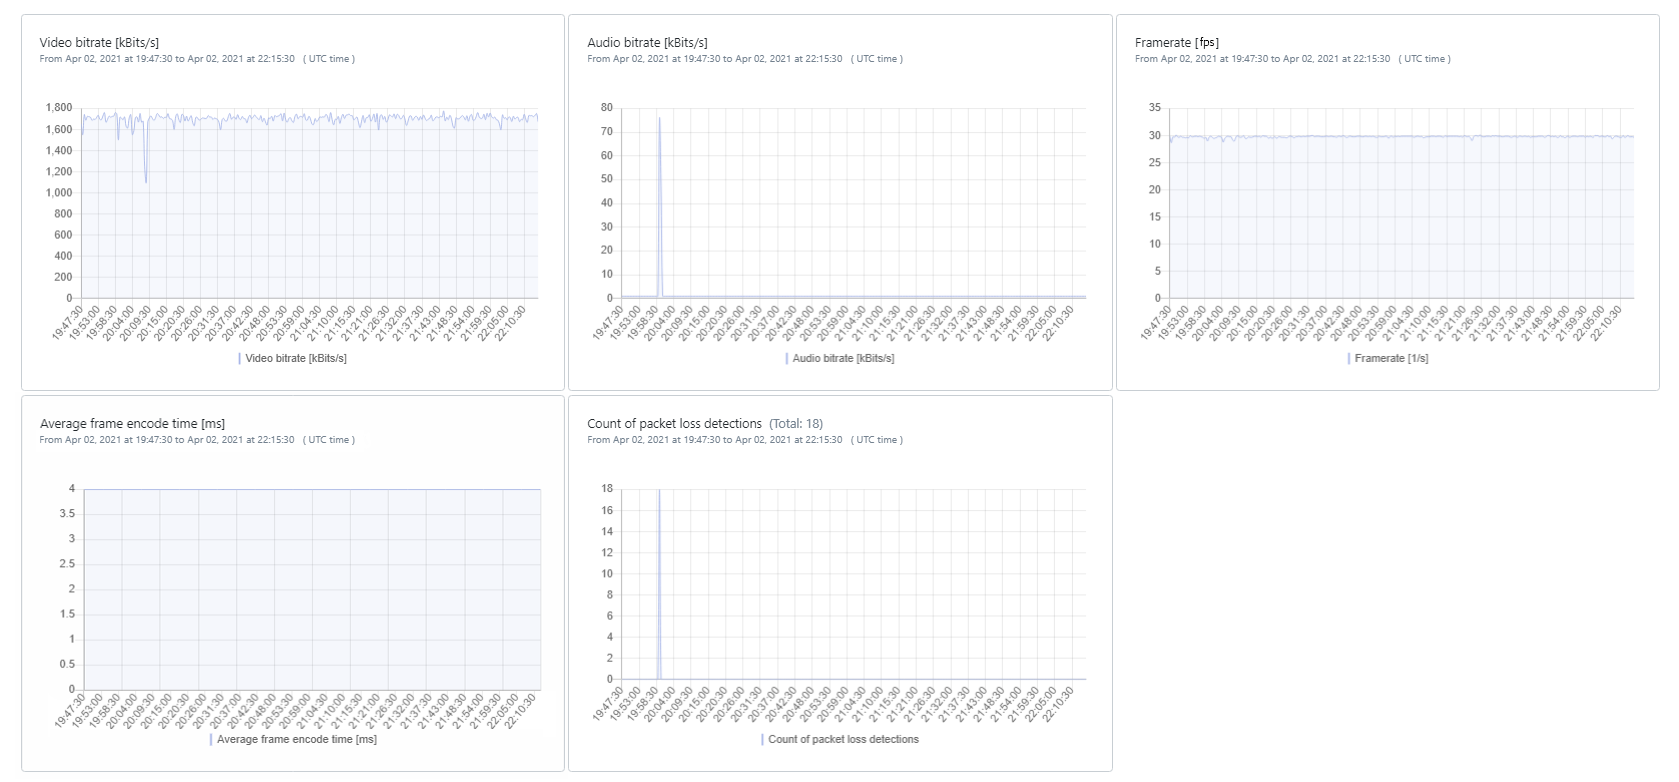 Screenshot: Troubleshoot Ingest Webcaster
Video bitrate[kBits/s]: Video bitrate of the ingested stream.Audio bitrate[kBits/s]: Audio bitrate of the ingested stream.Framerate[fps]: Framerate of the ingested stream.Average frame encode time[ms]: The average time needed to encode one frame of the stream.
Note that a long encode time is an indicator for high encoder workload, which can lead to ingest problems.
Count of packet loss detections: Amount of WebRTC notifications about lost data packages.
Note, a high count of lost packages at a time can lead to issues with the video representation on the side of the end user.
Ingest Quality Alerting
Via troubleshooting capability you can examine alerted streams and make potential issues visible, by checking the following metrics.
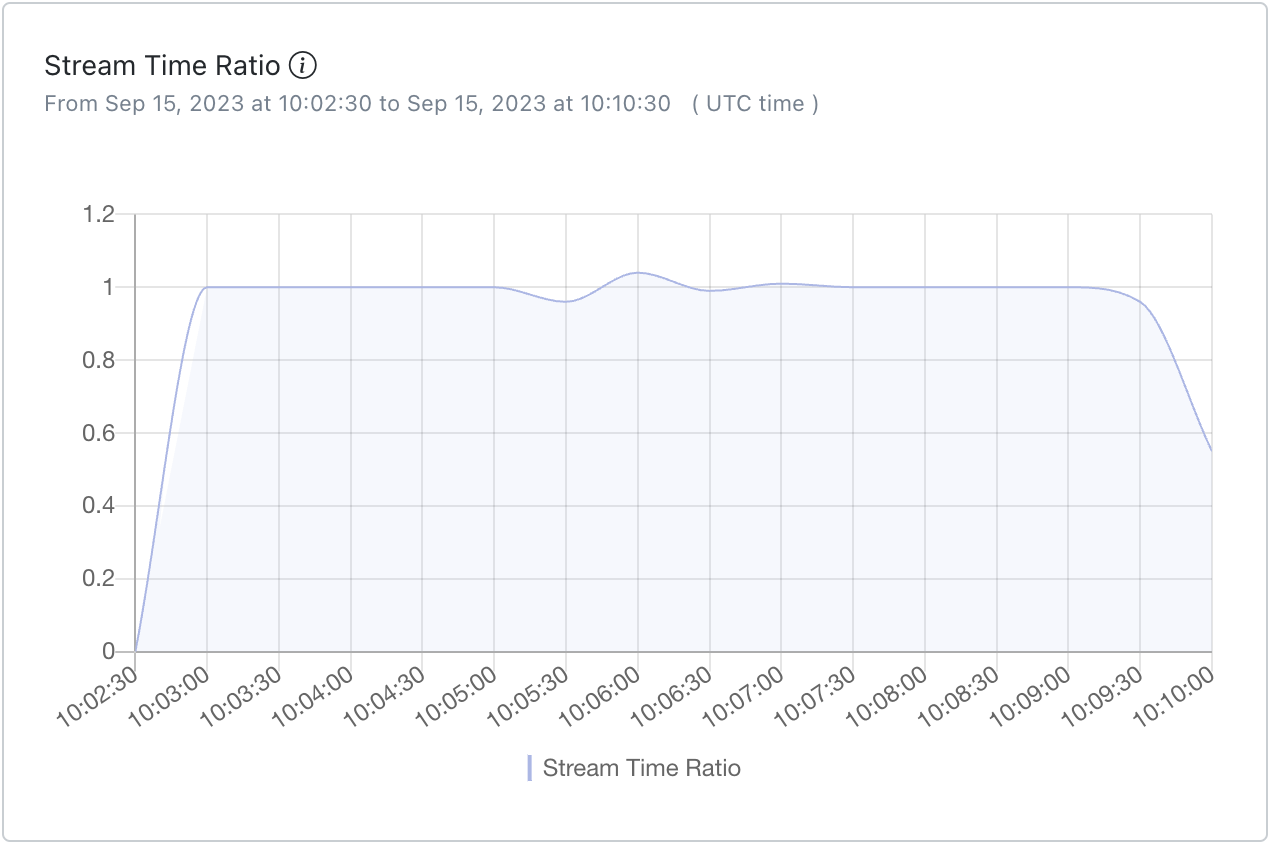
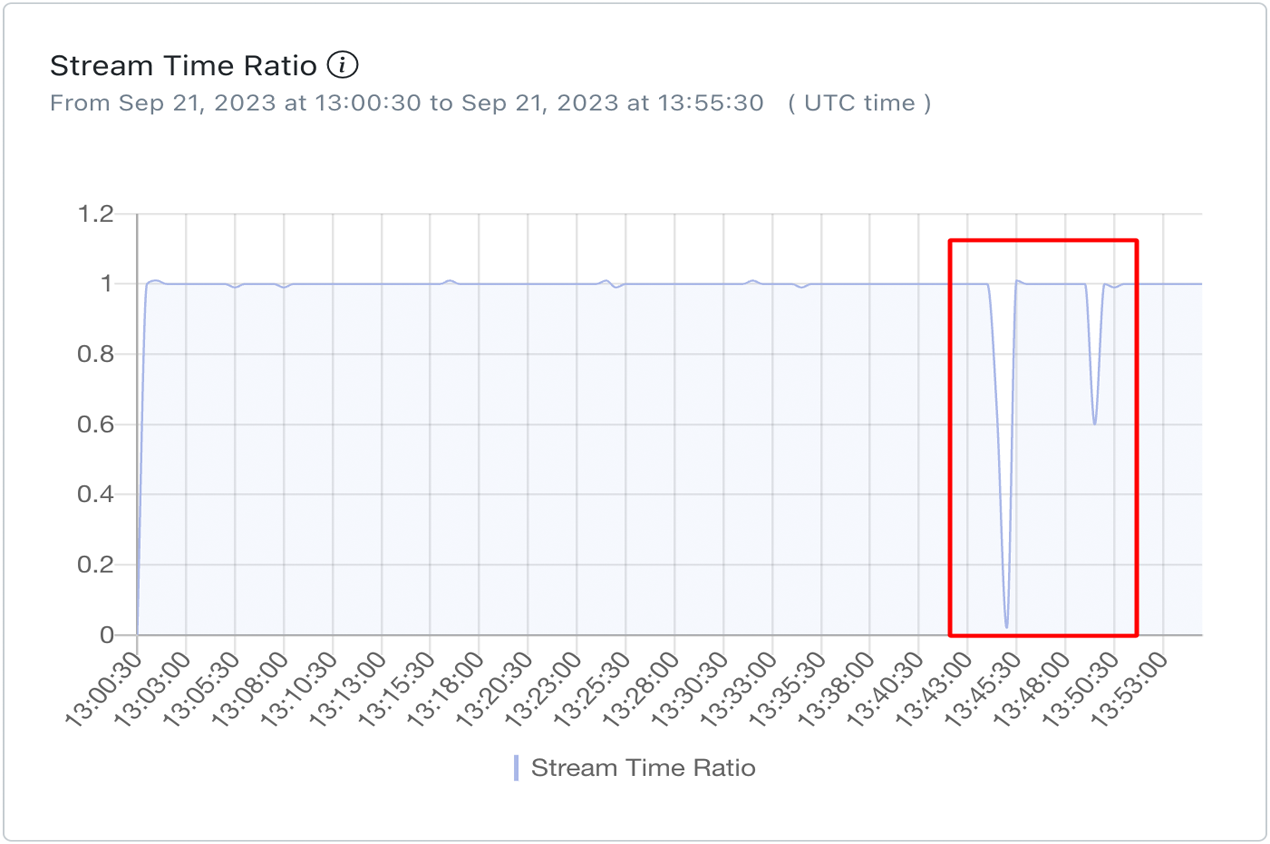
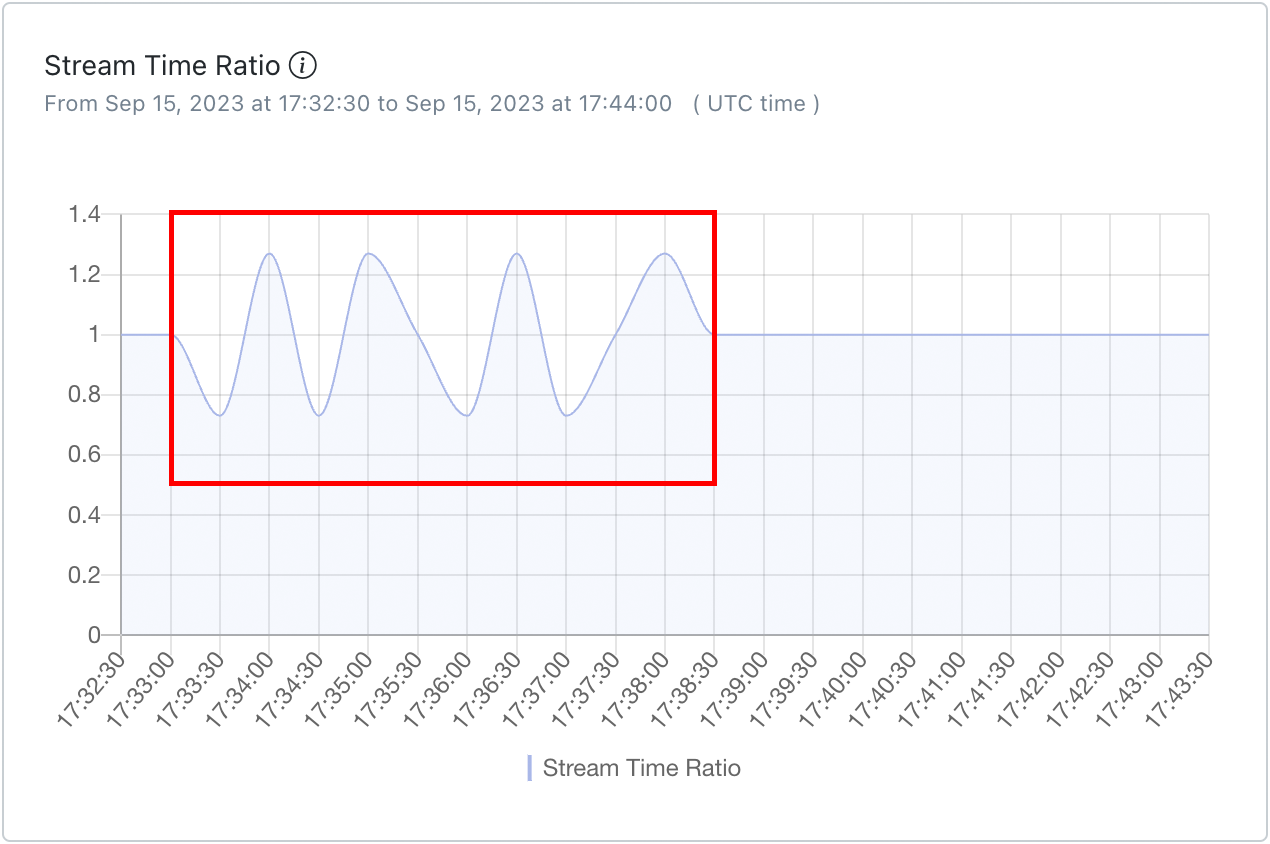
Stream Time Ratio
The stream time ratio (STR) represents the relation between the elapsed real time and the stream time within a window of 15 seconds. A constant ratio value of 1 would be ideal - but a small fluctuation is expected. A big fluctuation or deviation from the value 1 indicates issues on the ingest side, for instance caused by a limited bandwidth or high CPU load. The higher the deviation from the value 1, the higher the probability for an increased latency on the playback/viewer side.
Other Samples
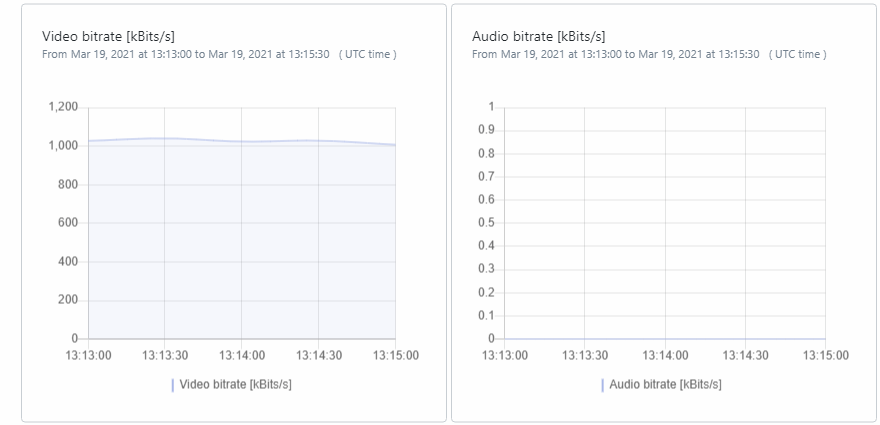
Video only ingest workflow
The figure below shows the graphical representation. In this scenario, only video bitrate data can be observed, while audio bitrate is not available. Also, the detected video bitrate is about 1 Mbps and this can be checked against settings on ingest encoder.
 Screenshot: Video Only
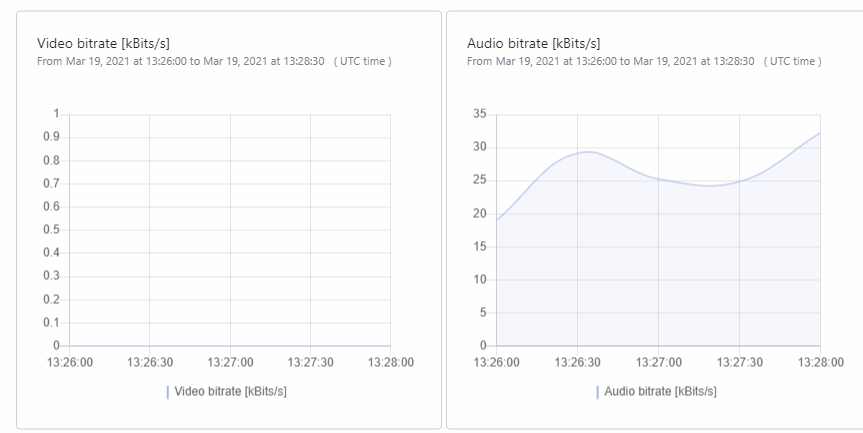
Audio only ingest workflow
The figure below shows the graphical representation. In this scenario, only audio bitrate data can be observed, while video bitrate is not available. Similarly, the detected audio bitrate is averaging above 25Kbps and this can be checked against settings on ingest encoder.
 Screenshot: Audio Only Ingest Workflow
Audio/Video ingest workflow in good condition
The figure below shows the graphical representation. As can be observed, the average video bitrate is about 1.2Mbps while audio bitrate is about 90Kbps. The video and audio bitrates do not deviate too much from the average over time and will not cause overflow or underflow of buffers.
Screenshot Audio/Video Ingest Workflow in good condition
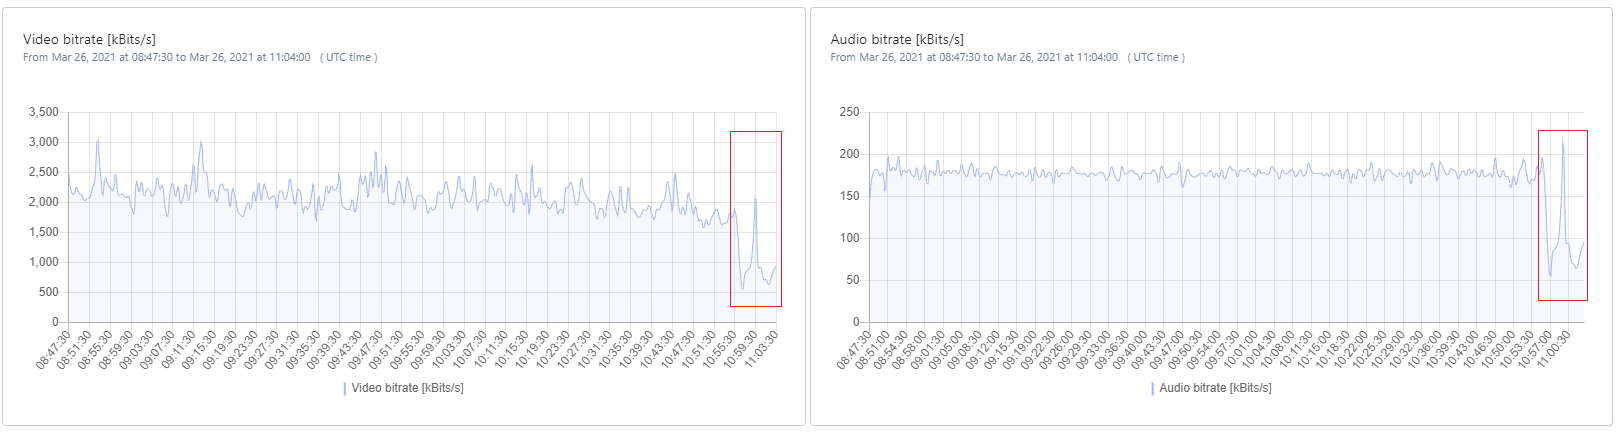
Audio/Video ingest workflow with network issues
The figure below shows the graphical representation. As can be observed, the average video bitrate is about 2Mbps while audio bitrate is about 150Kbps. Towards the end of the graph as highlighted by the red box, the video and audio bitrates fluctuate by more than 50% of the average. This signifies some issues with the ingest from the encoder to nanocosmos CDN. Some causes of these could be ISP related network degradation or encoding anomalies. If this issue is not rectified quickly, then it will cause overflow or underflow of buffers resulting in buffering, connection issues, etc.
 Screenshot: Audio/Video Ingest workflow with network issues